On-line energy management
Energy savings and waste reduction in your hands from anywhere. The app significantly simplifies regular energy management related tasks.
Detailed consumption and cost statistics
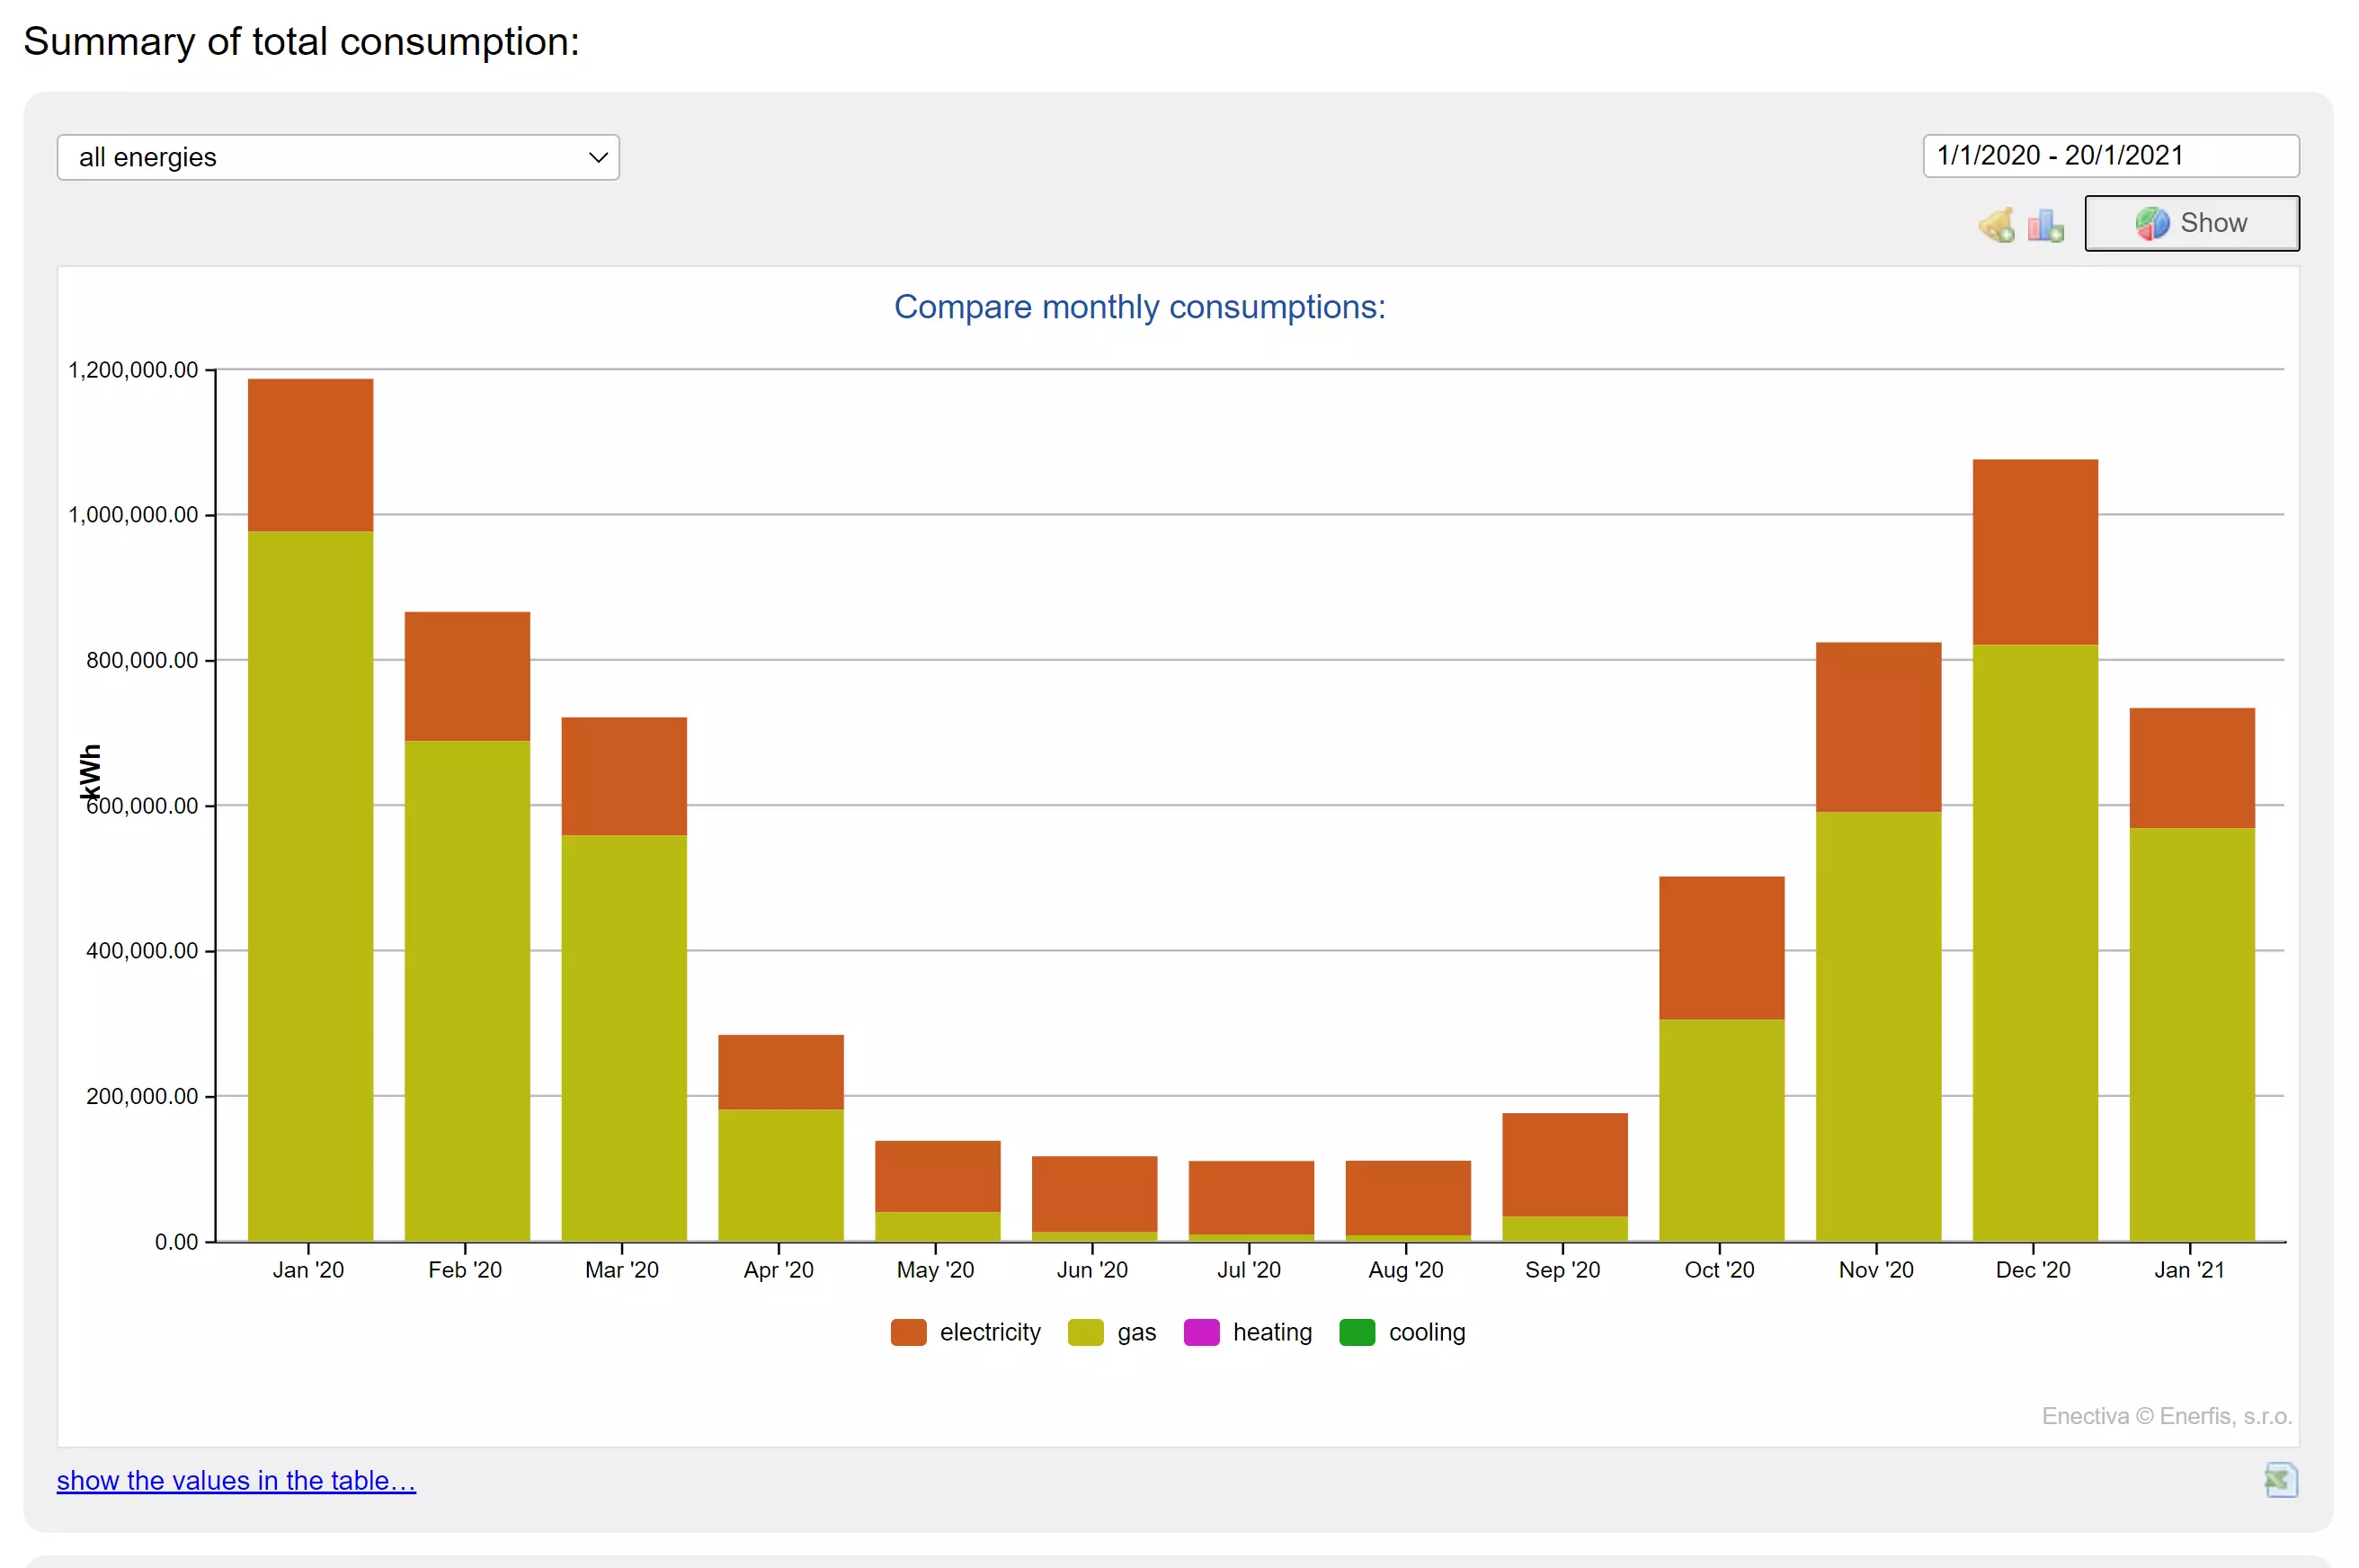
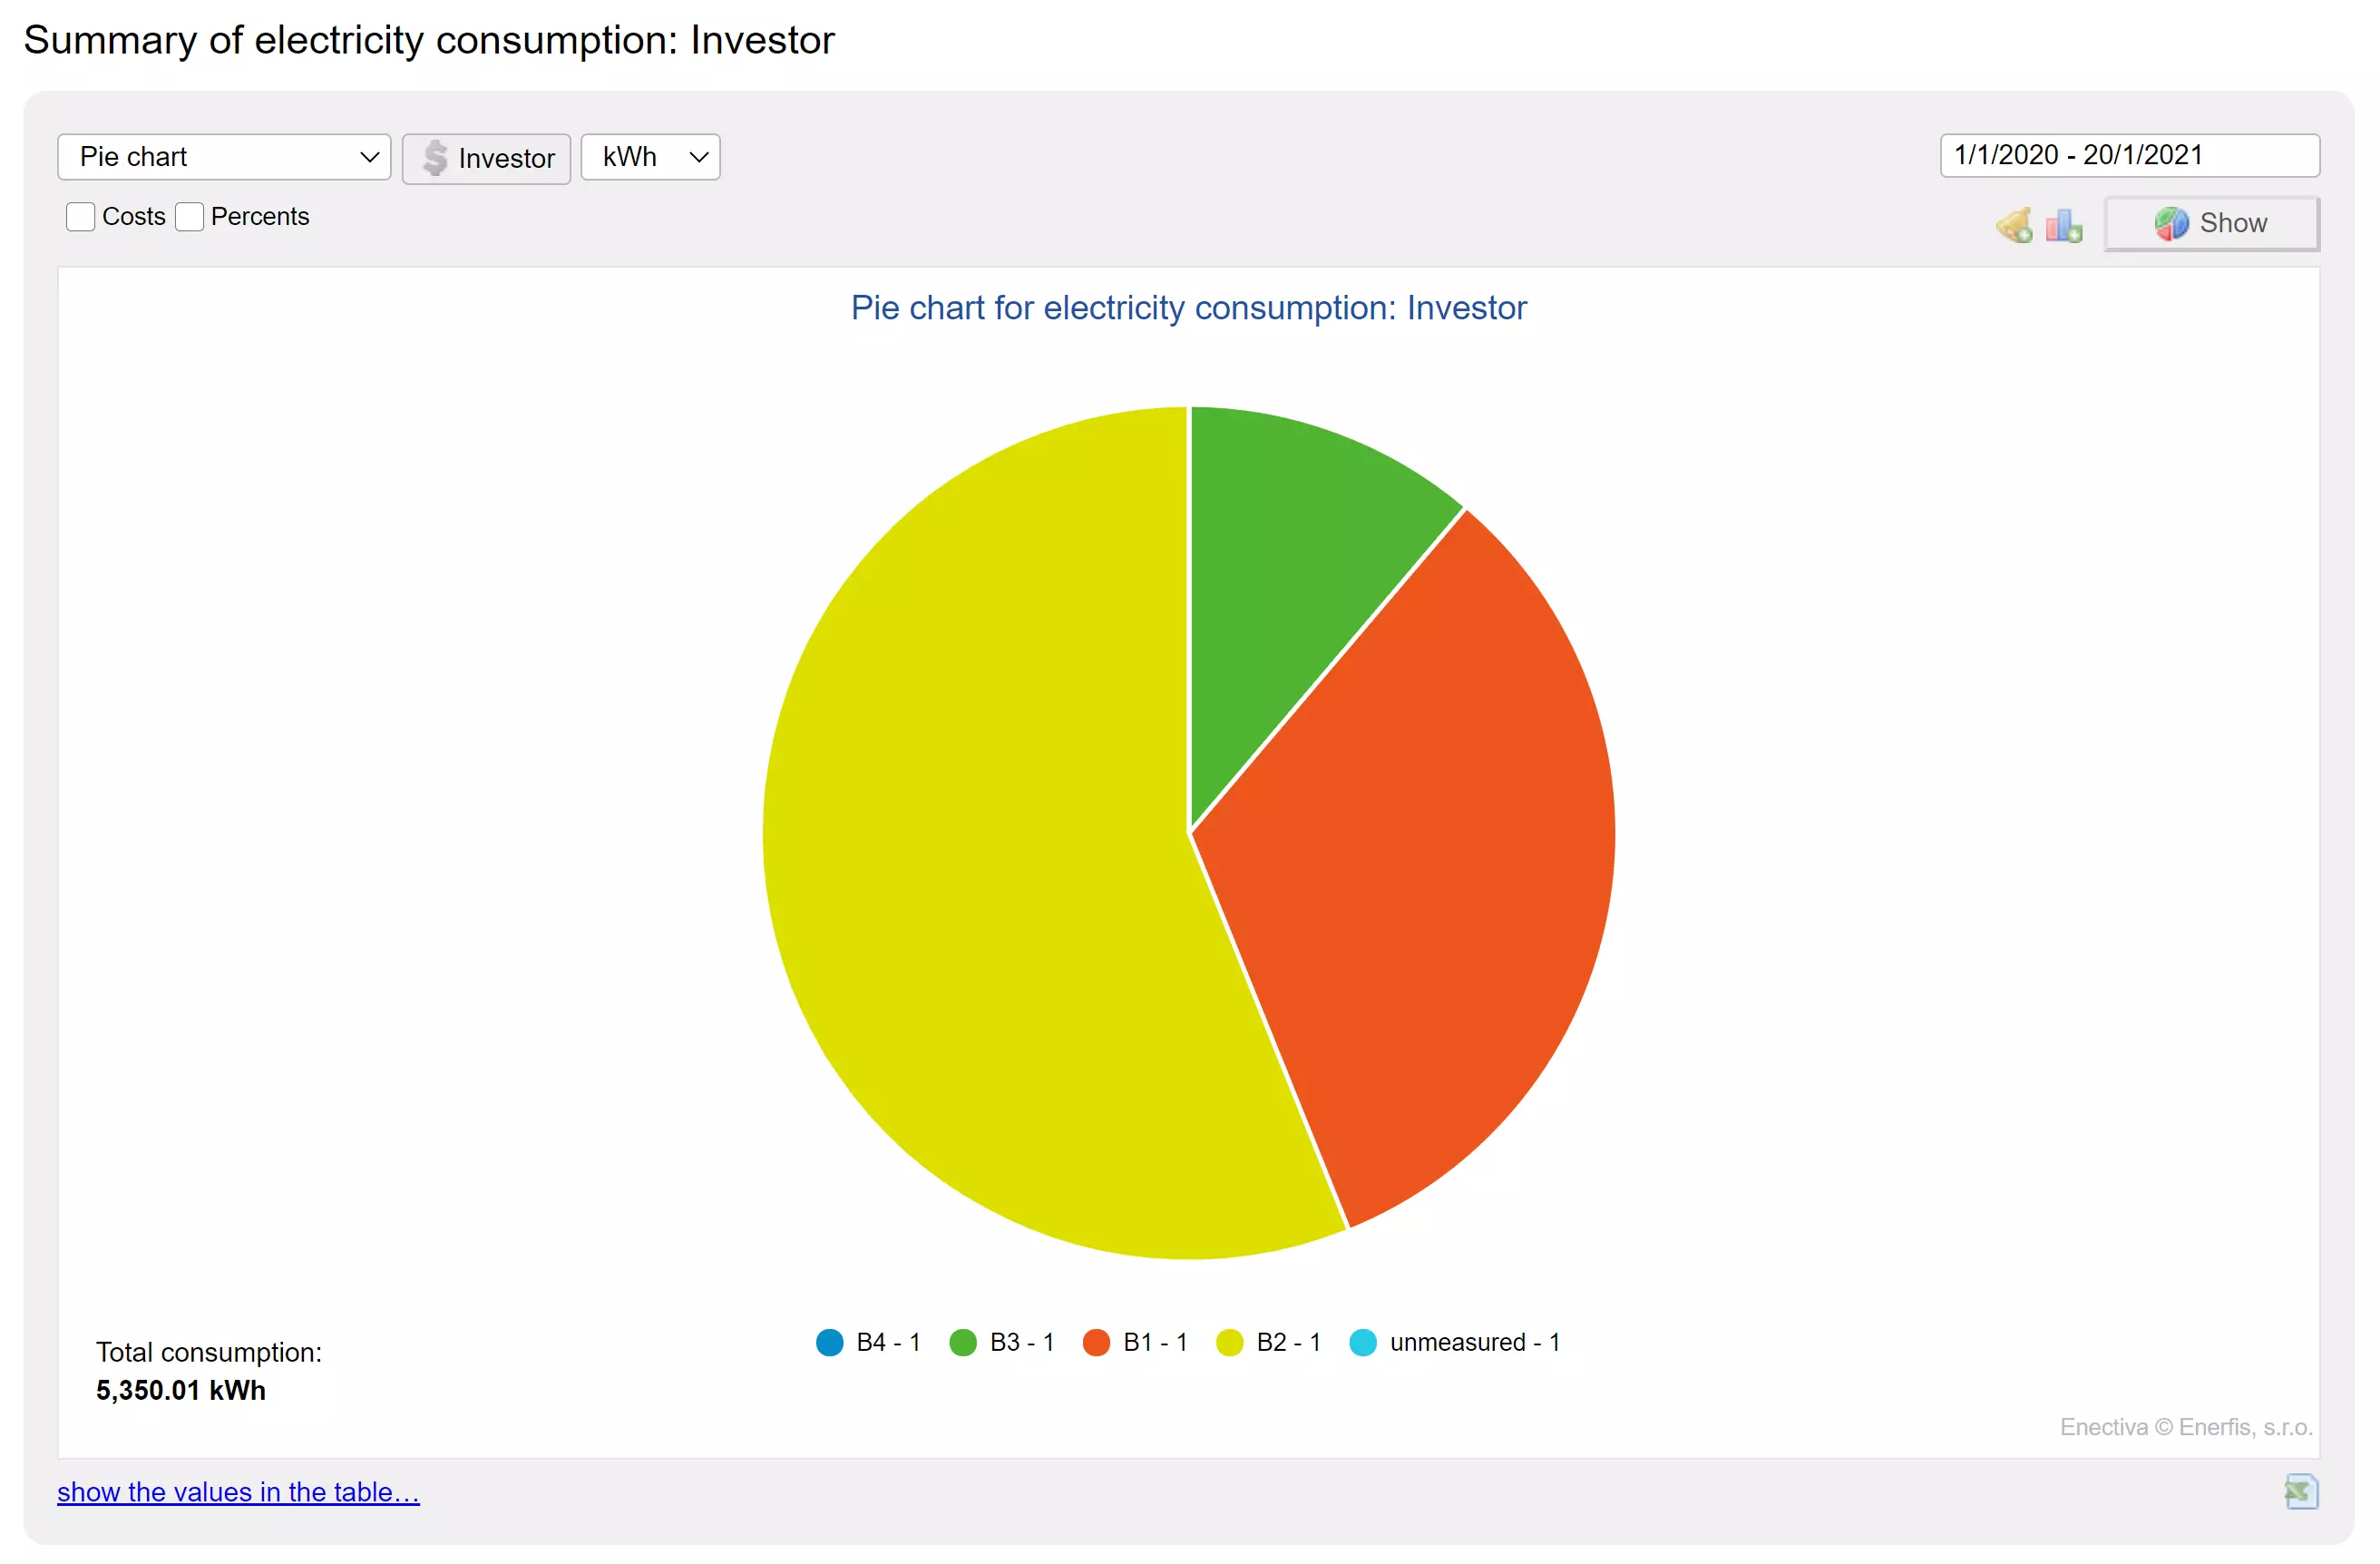
Thanks to Enectiva, you will have all your data nicely arranged in one place. This allows you to monitor the consumption of all energies as well as data collected by the sensors. Energy monitoring can be then further divided up by application. In case of electricity, this includes the consumption of the air conditioning system, cooling, lighting and production. All displayed energy data can be viewed in technical and monetary units.
Consumption charts
Monitor the development of energy consumption during the year, days, hours or minutes, keeping constant track of your current consumption.
Energy costs
You can also view any chart in monetary terms. You can immediately see how much leaking water or overheated space costs you.
Automatic alarms
Set up an alert for exceeding the key consumption parameters. You can use e-mail or SMS.
Weather data
Weather data are part of our solution for even greater added value when evaluating or identifying cost-saving measures.
Automatic reports
Automatically generated reports on daily, weekly or monthly consumption, costs or the results of implemented cost-saving measures take care of regular activities, reducing the administrative burden on your team.
Regular reporting
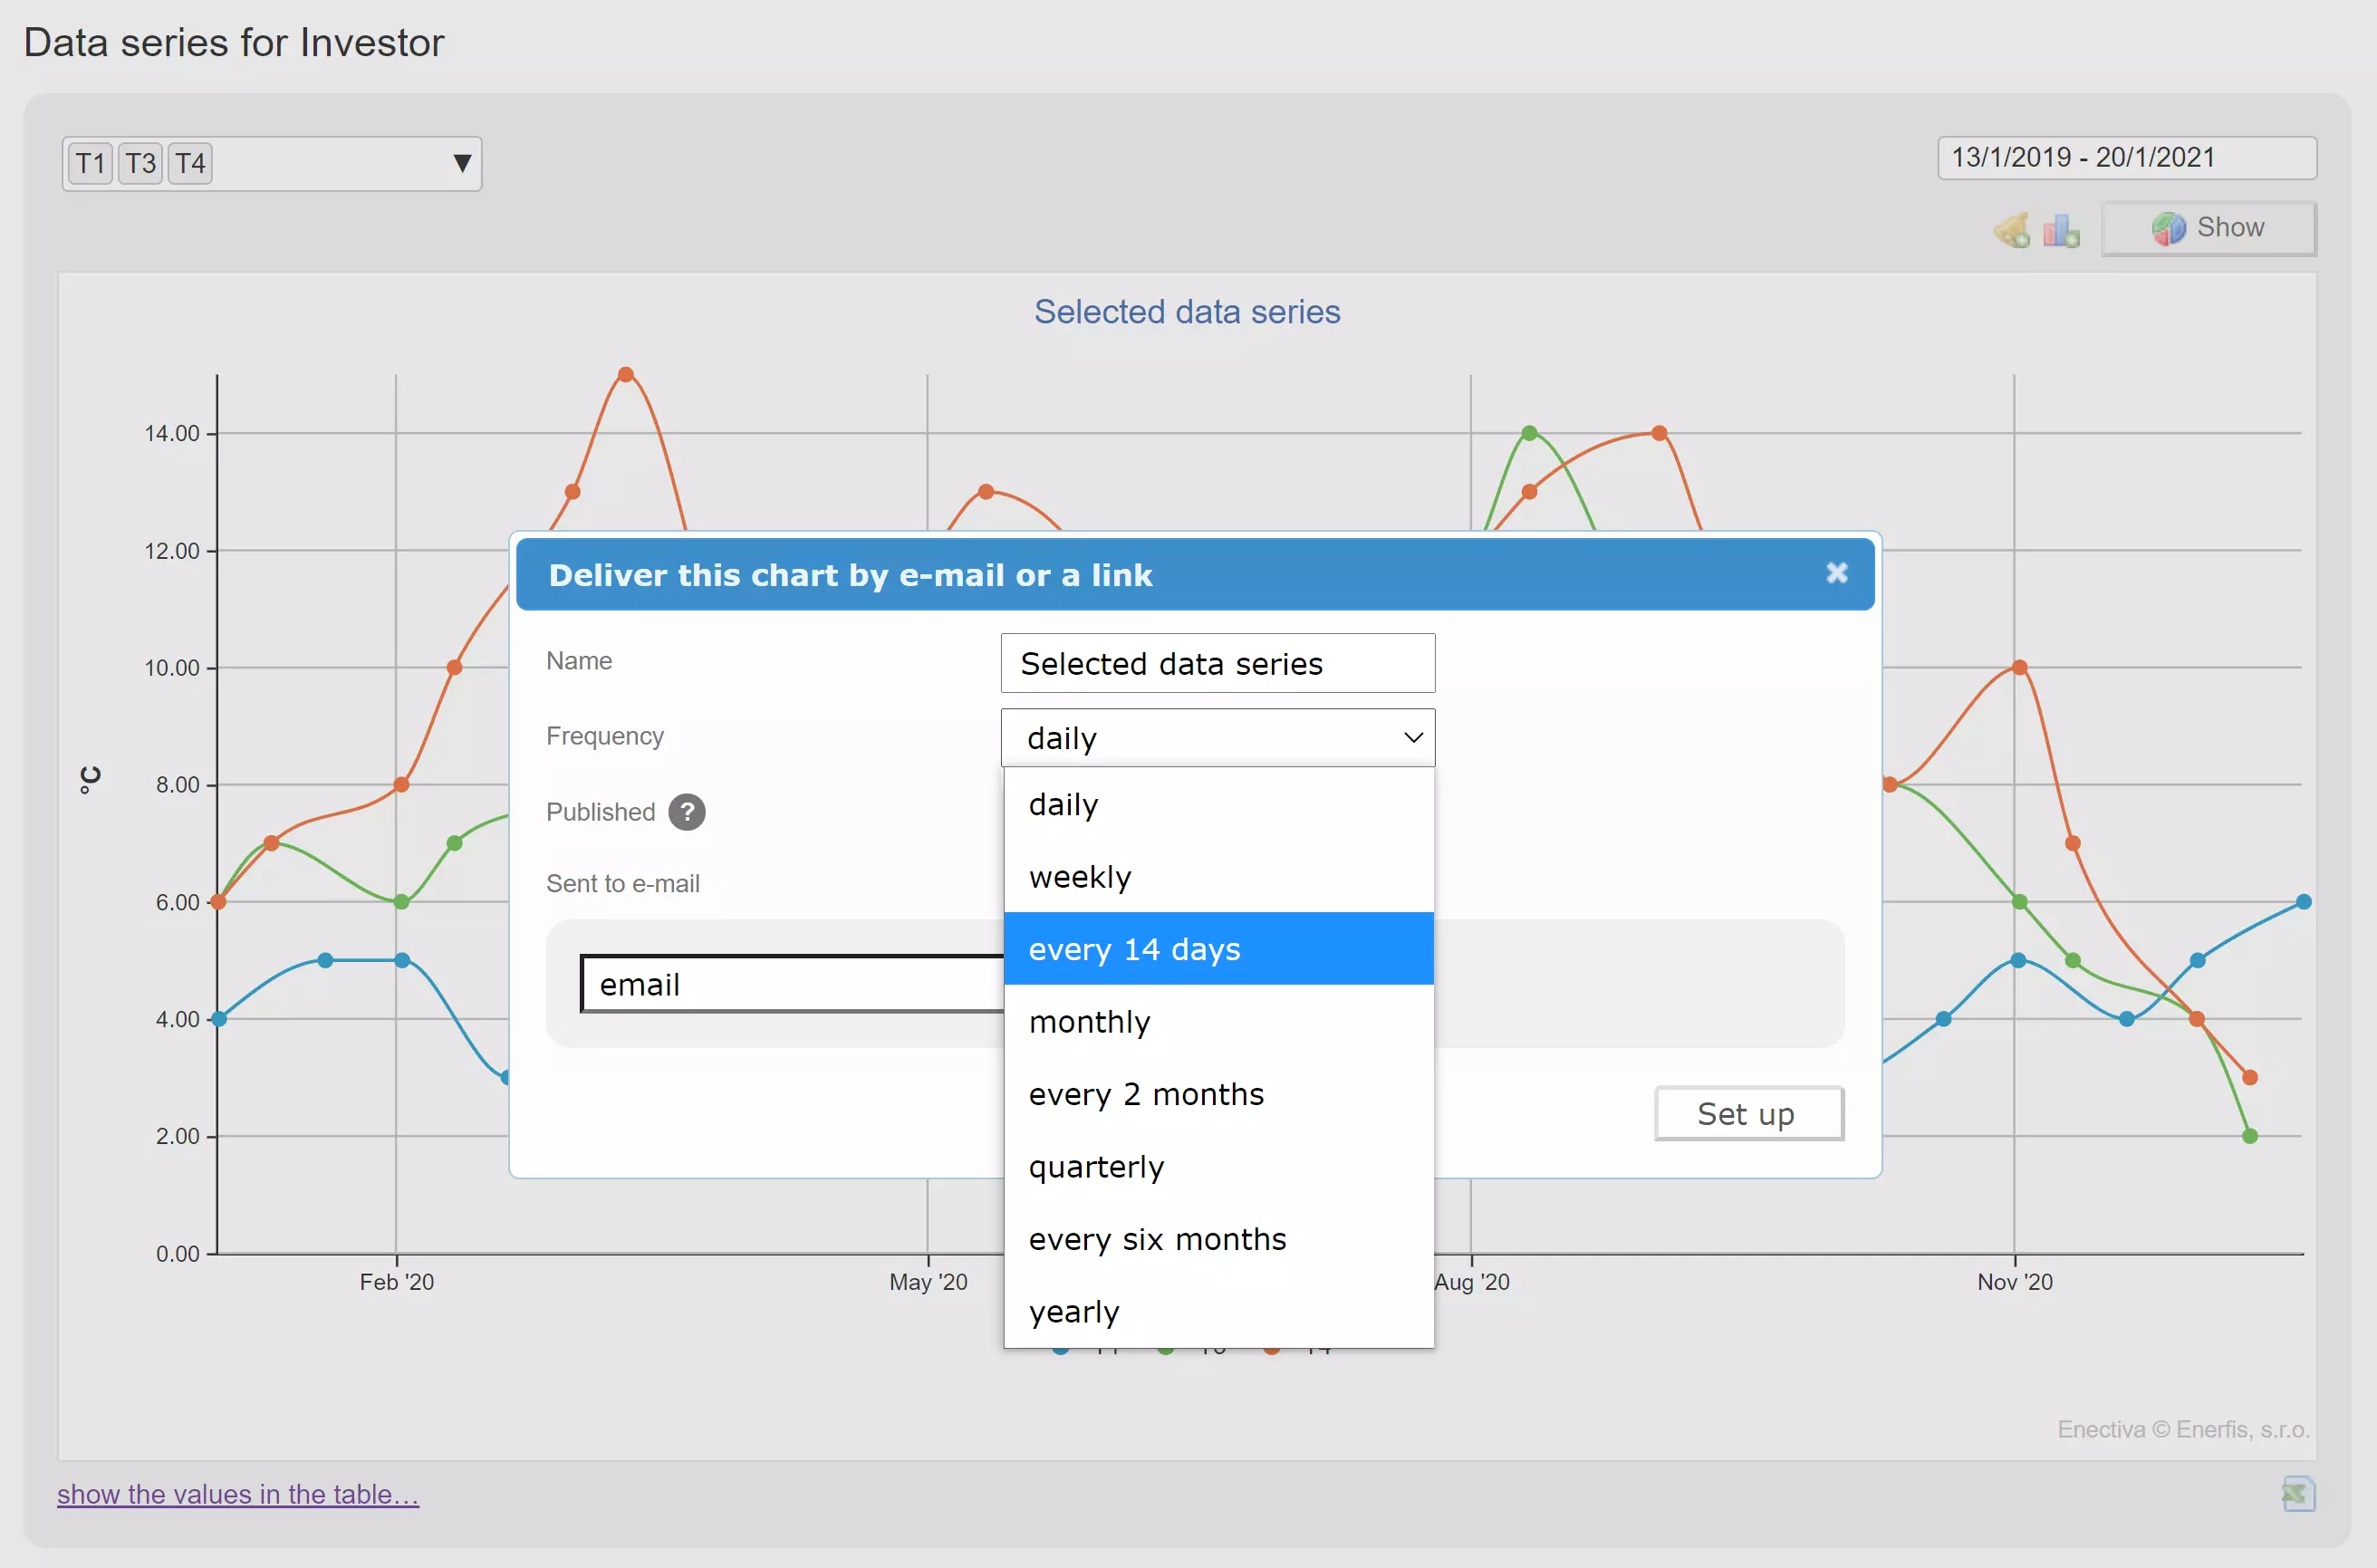
Enectiva automatically sends selected data to your e-mail address. The scope and composition of reported data is completely up to you. You can add consumption and cost related data to the report in the form of tables or charts. Every user can set up their own report composition in order to receive only relevant data. This ensures that you do not have to go over huge data files and look for the data you need.
Alerts and alarms
Alerts automatically notify you that a certain critical consumption, temperate or cost point has been reached. It is again only up to you to decide what should be monitored by Enectiva. This may include exceeding a certain consumption or cost level, the need to carry out an overhaul on any of your technologies, or a change in outdoor temperature. Correctly set alerts will help you detect a lot of waste during the year.
Analysis of cost-saving measures
Whenever you implement any cost-saving project or implement a cost-saving measure in your building, you will enter the second and no less important phase of the project – monitoring, evaluation, reporting and potentially further optimization. Even the best design cannot cover all the factors that influence the real results. If you care about the energy savings you have achieved, you cannot do without evaluating the results.
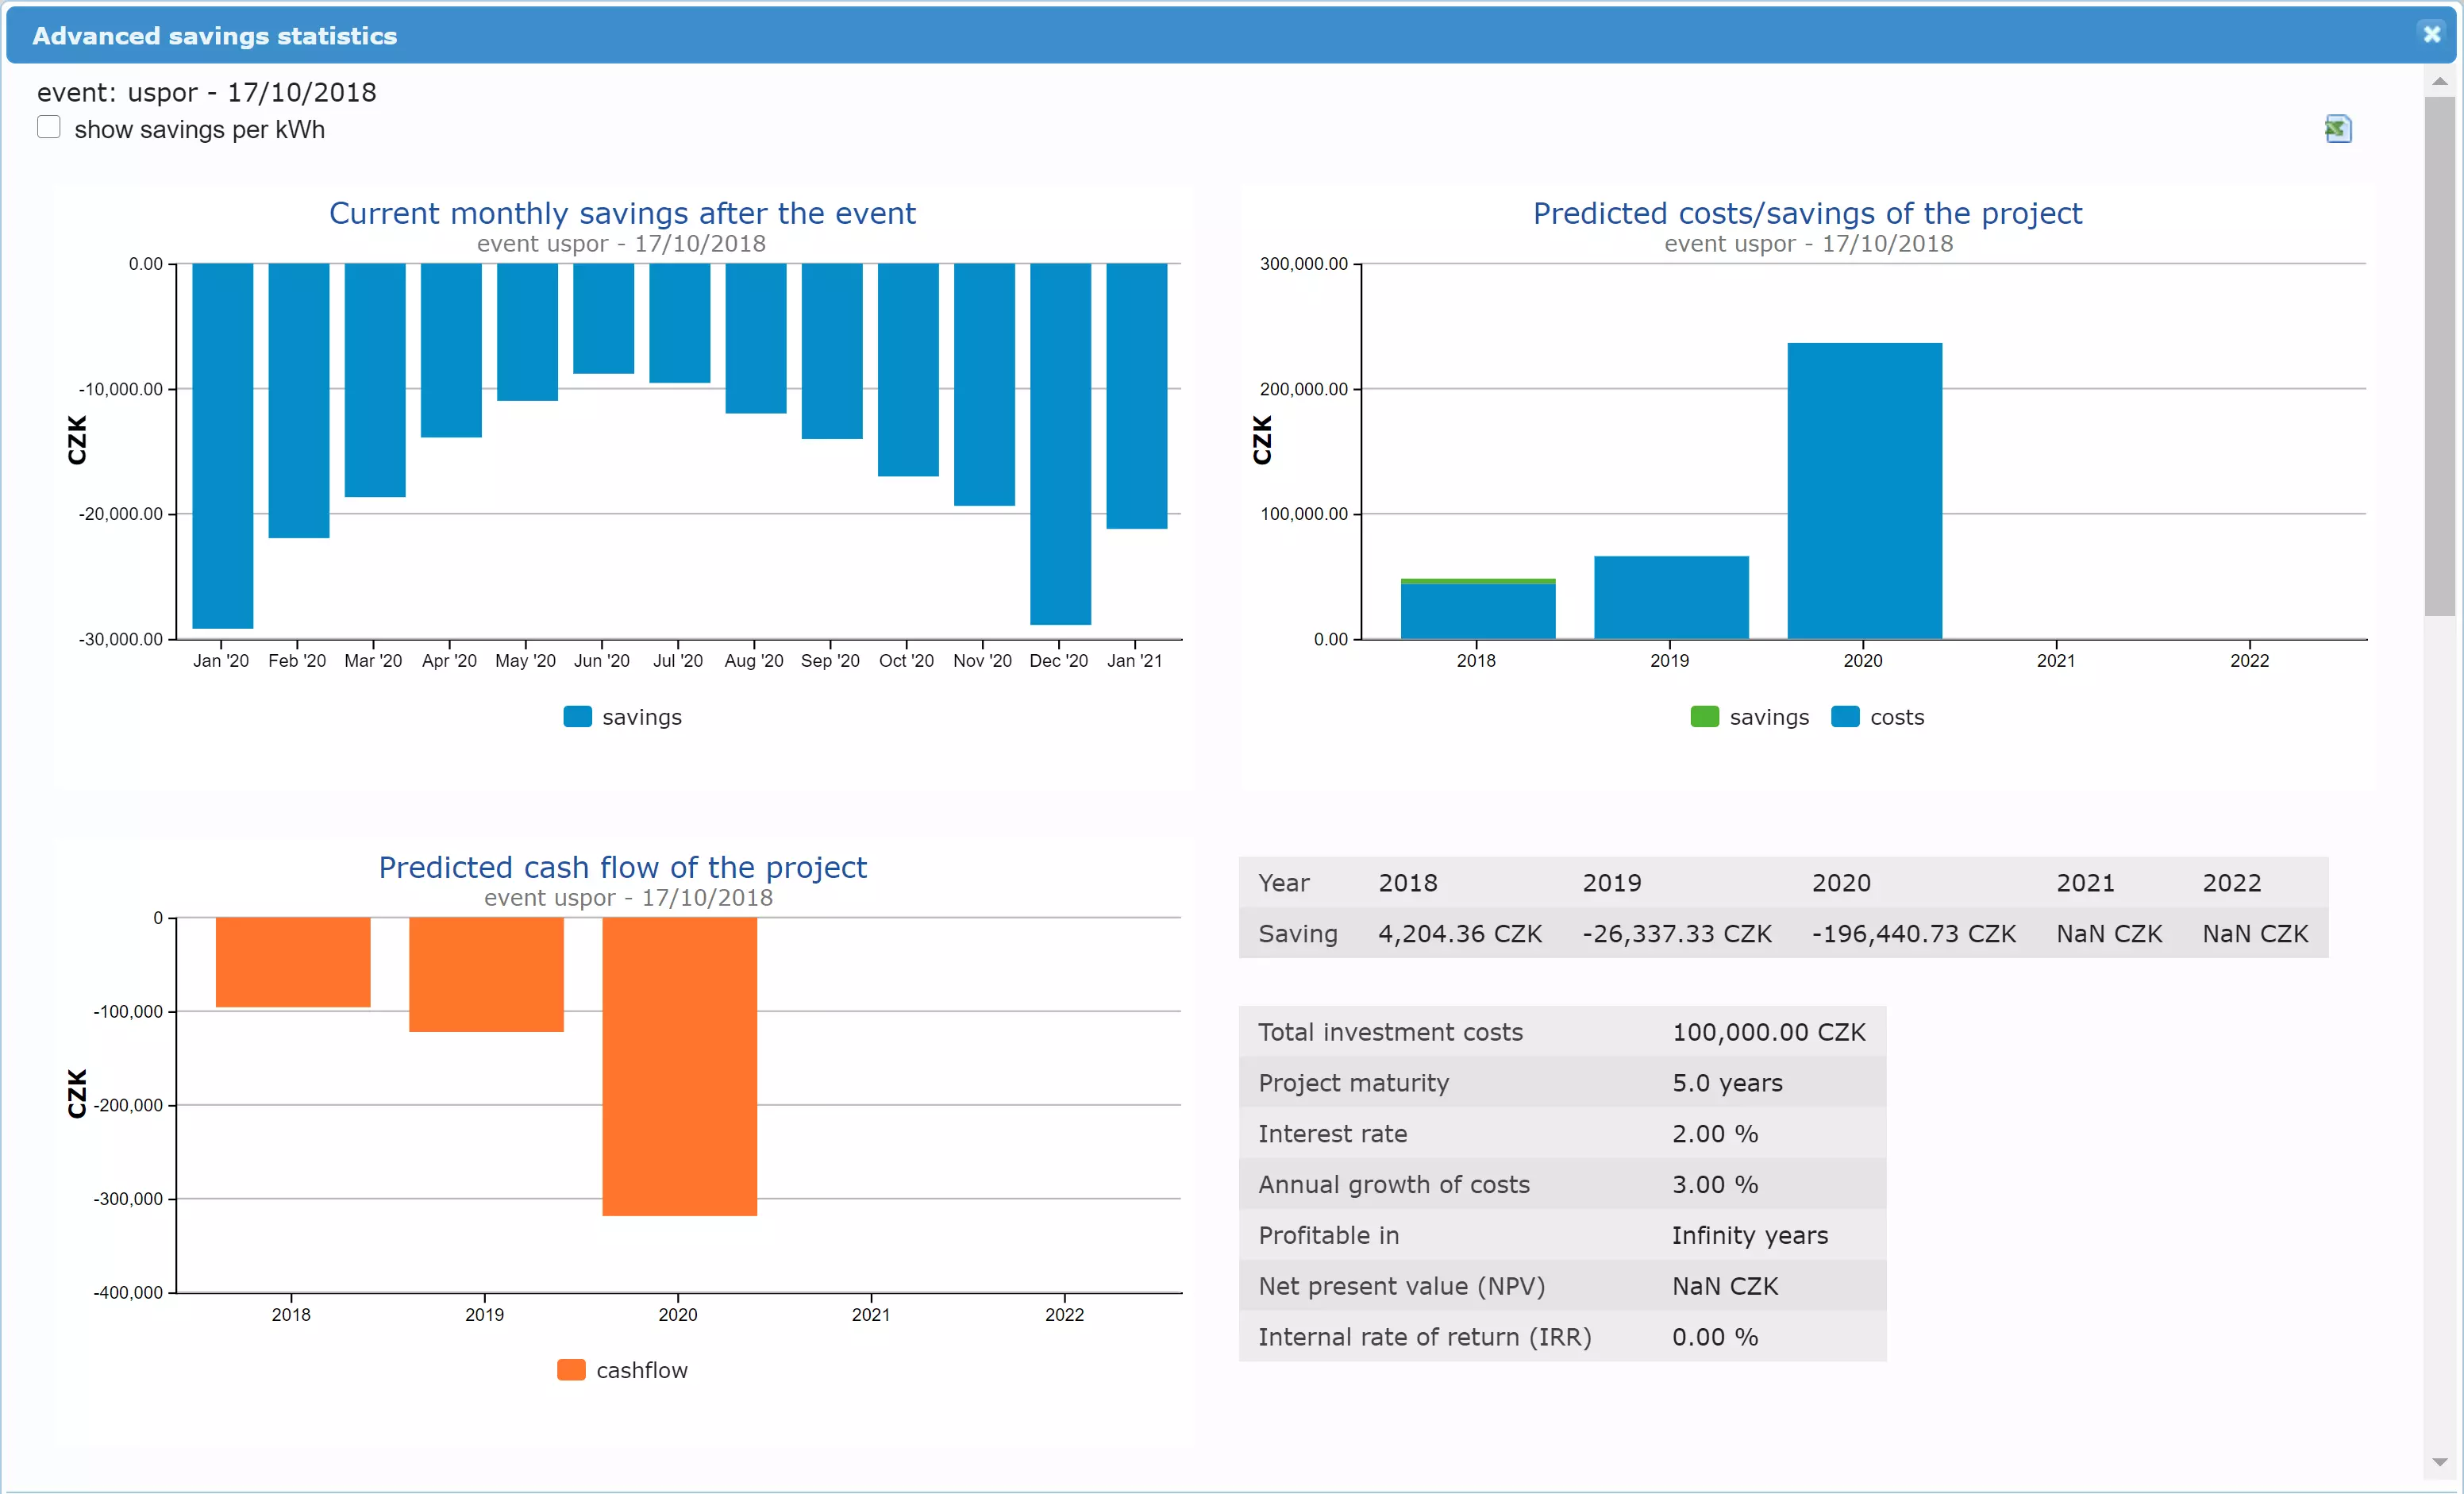
Enectiva will perform all calculations for you, forecast your costs and savings based on the average figures for the last 3 years, create an overview of monthly savings resulting from the measures taken, and predict your cash flow. You can then easily find out if the project is in the phase of repayment or profitability, and what the current estimated NPV (Net Present Value) at the end of the project life is.
Current weather data directly in the app
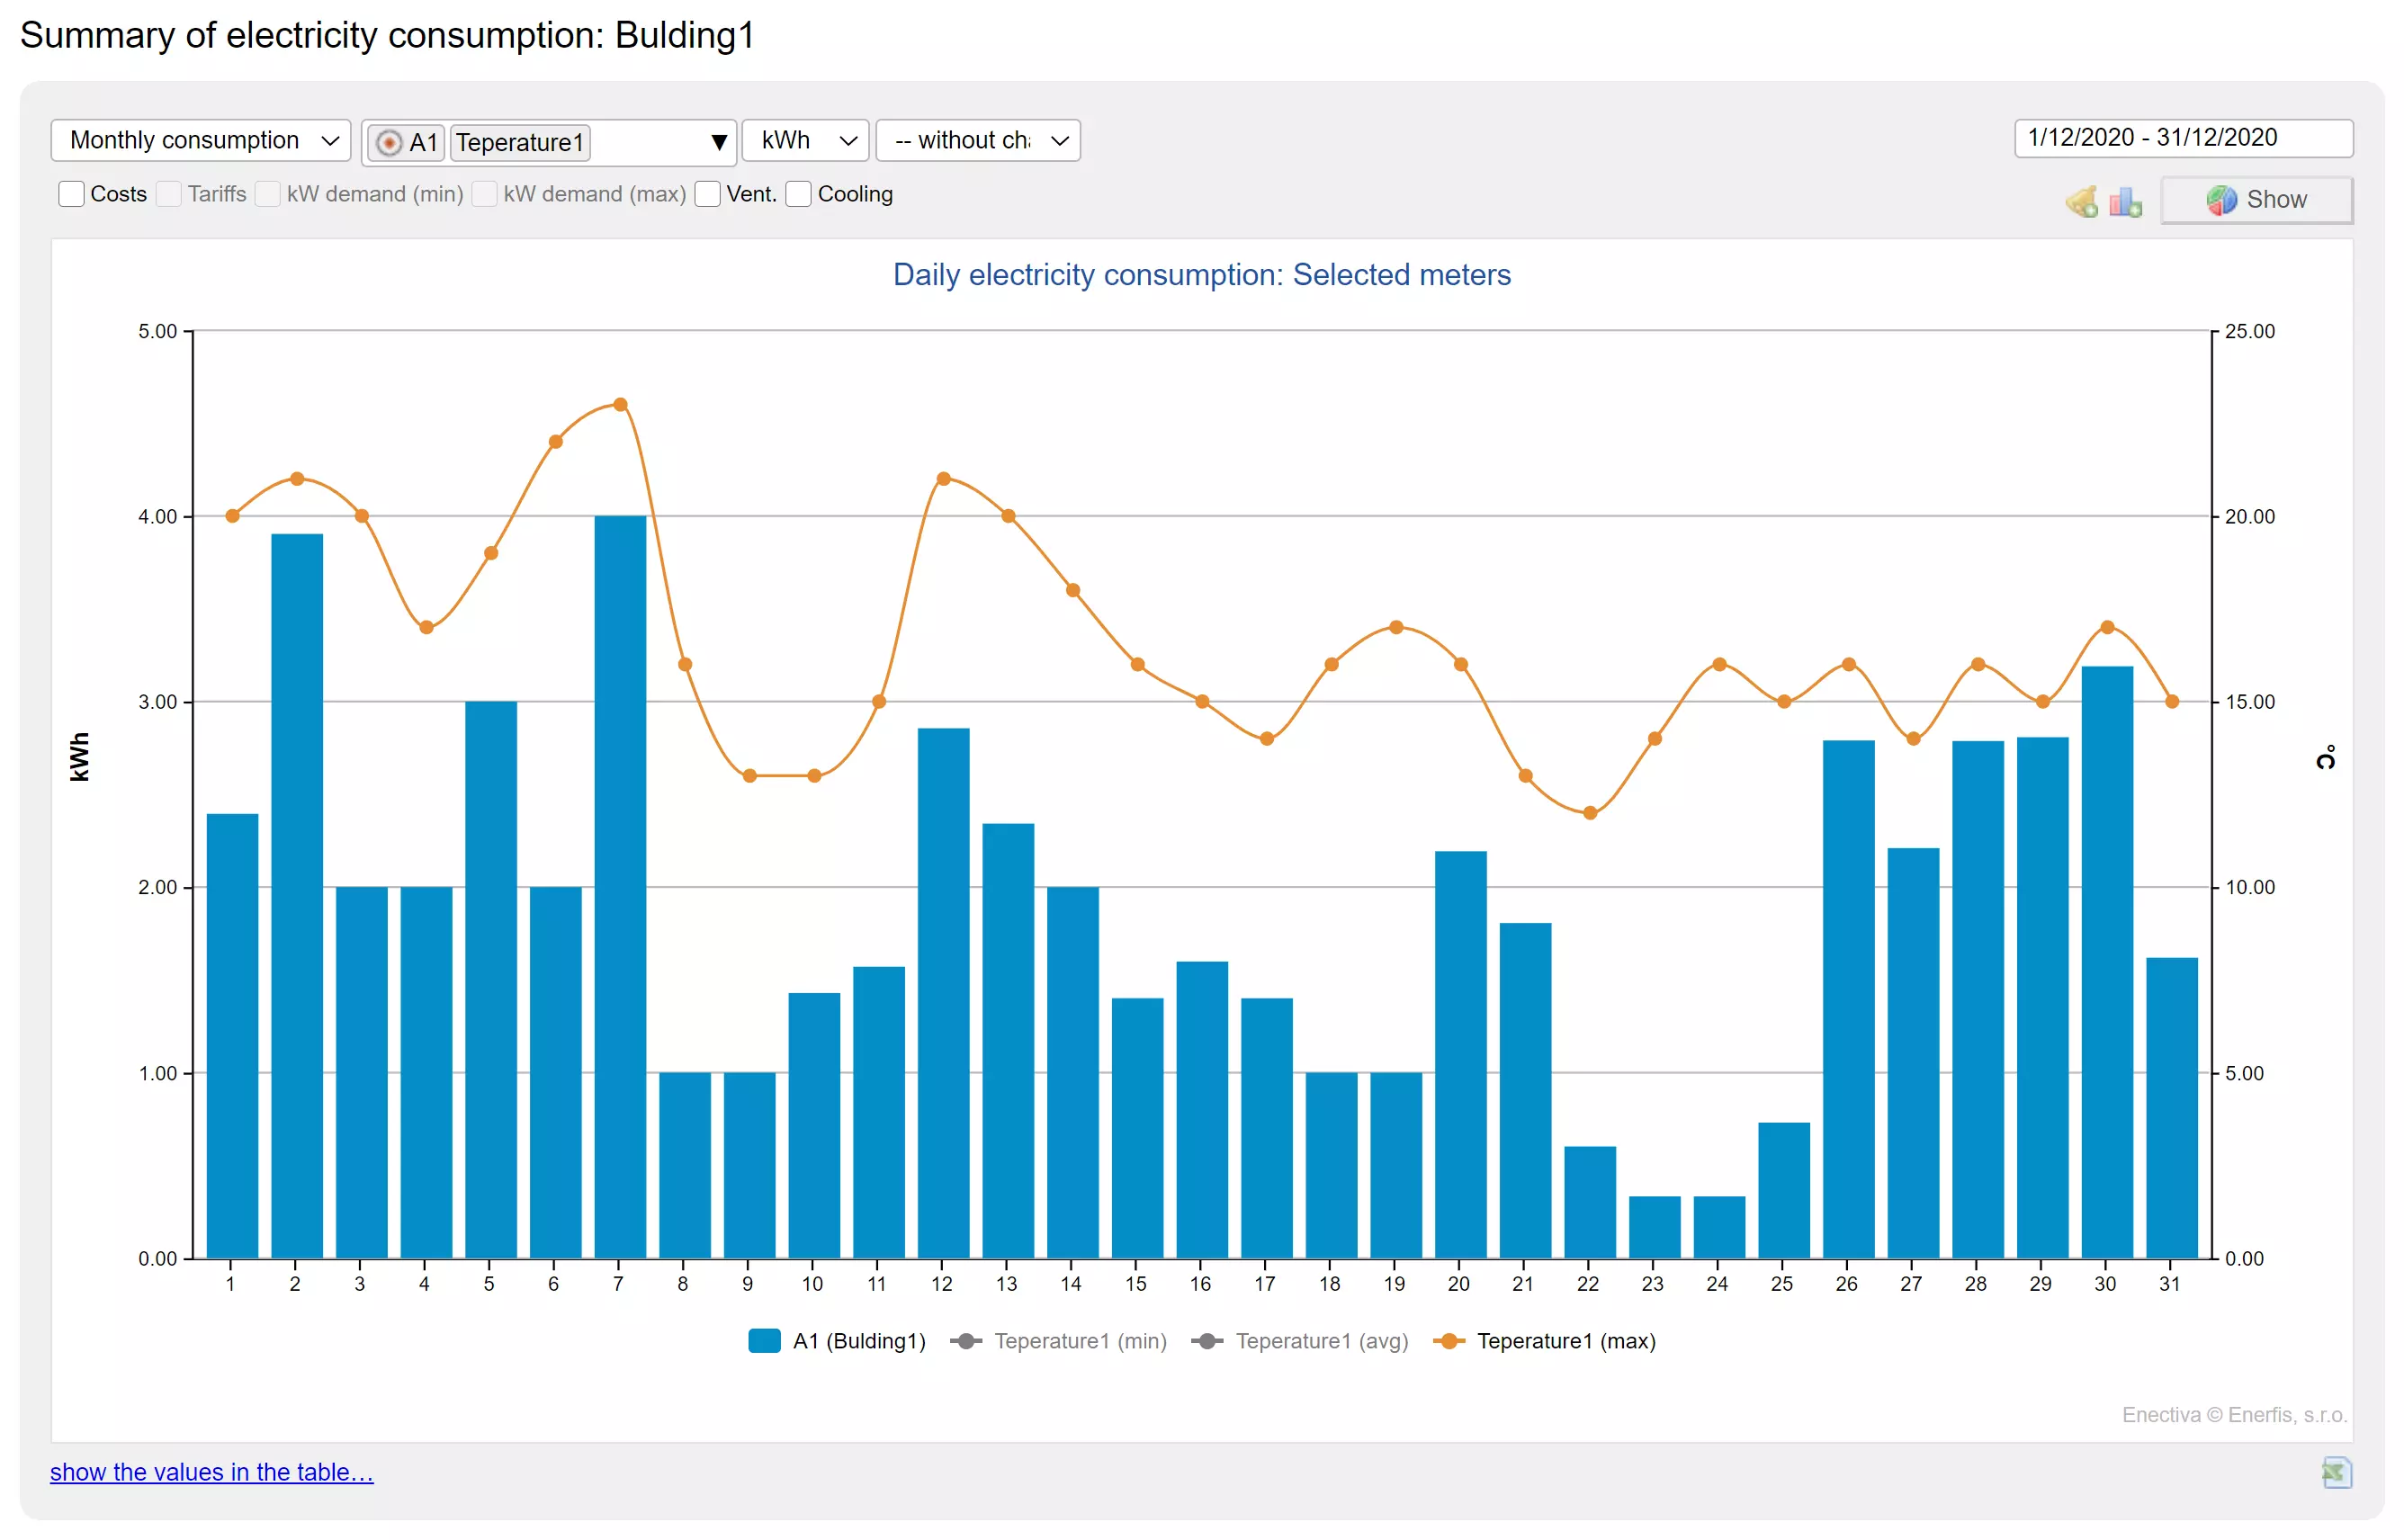
Enectiva is connected to a network of weather stations throughout the Czech Republic. You will choose the one closest to the property. You can view weather data in a chart together with consumption data for the individual energies. This allows you to easily find out whether the energy used for heating and cooling is consistent with the outdoor weather conditions. Such comparison is an easy way how to reveal errors in the control settings of these systems.
Unlimited number of users under a single license
The licensing of Enectiva is unique on the Czech market primarily due to the fact that it is only based on the amount of data that is fed from meters and sensors to the app. You can determine the number of user accounts directly in the Enectiva interface according to your current needs without this change affecting your bill in any way. Another benefit of this method of licensing is the eliminated need to communicate with the sales team to increase or lower the number of user accounts as well as the administration associated with it. This results in faster user account management that responds to your current needs immediately.
Support for manual and automatic remote readings
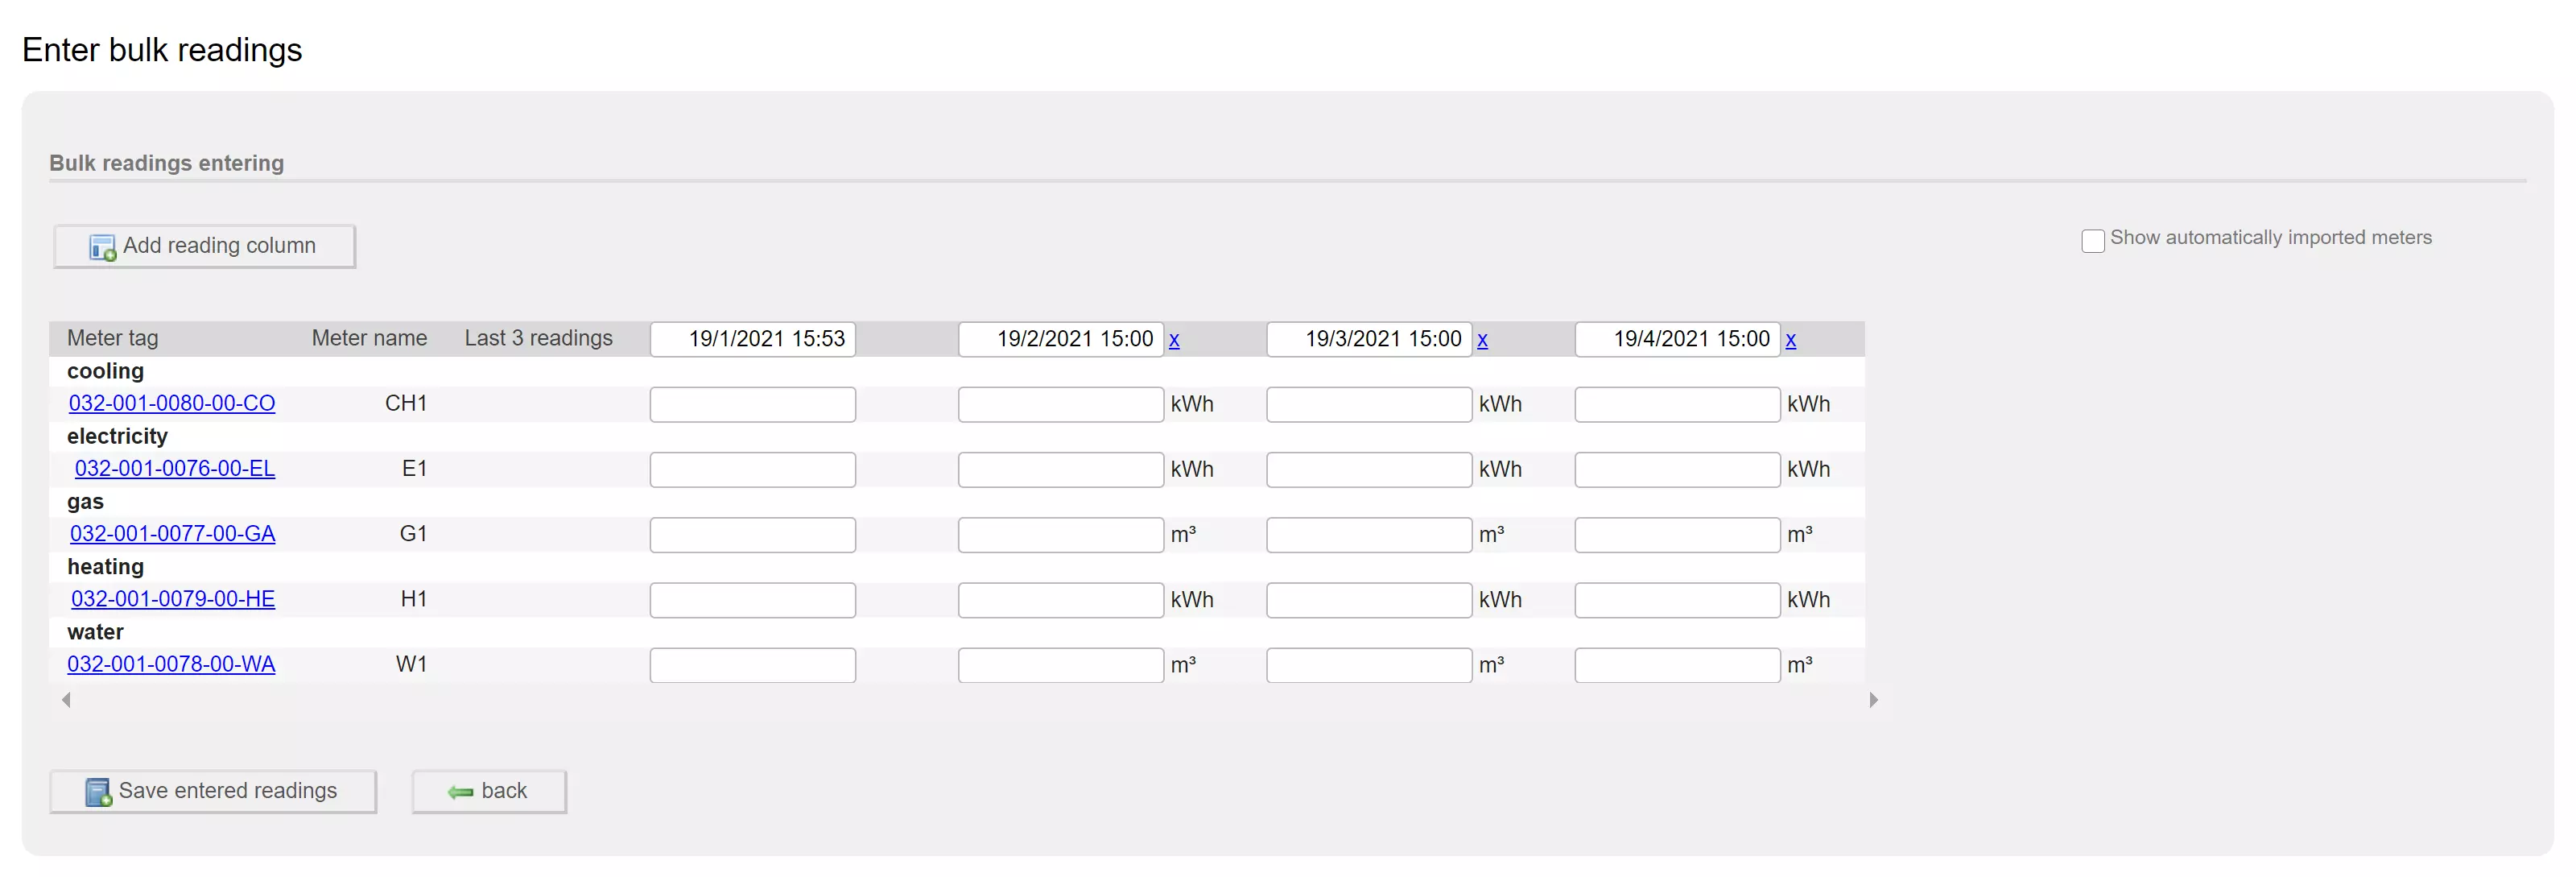
Readings can be entered into Enectiva manually or sent remotely and fully automatically from the meters and sensors directly in the system. A period ranging from seconds to one day can be set up for automatic readings that save your technicians time. Our customers, who have a larger number of buildings, enjoy the option to mix automatic and manual readings. It is not a problem for Enectiva, and it is solely up to the customer to decide which meters they wish to read in which manner.
High granularity
Set the frequency of readings from manual monthly, to daily, hourly or every second on critical meters.
Hardware independence
We also collect data via M-Bus, Modbus, WMbus, Bacnet, S0, pulses, and transmit them via fixed, mobile and IoT networks.
integrated energy price lists
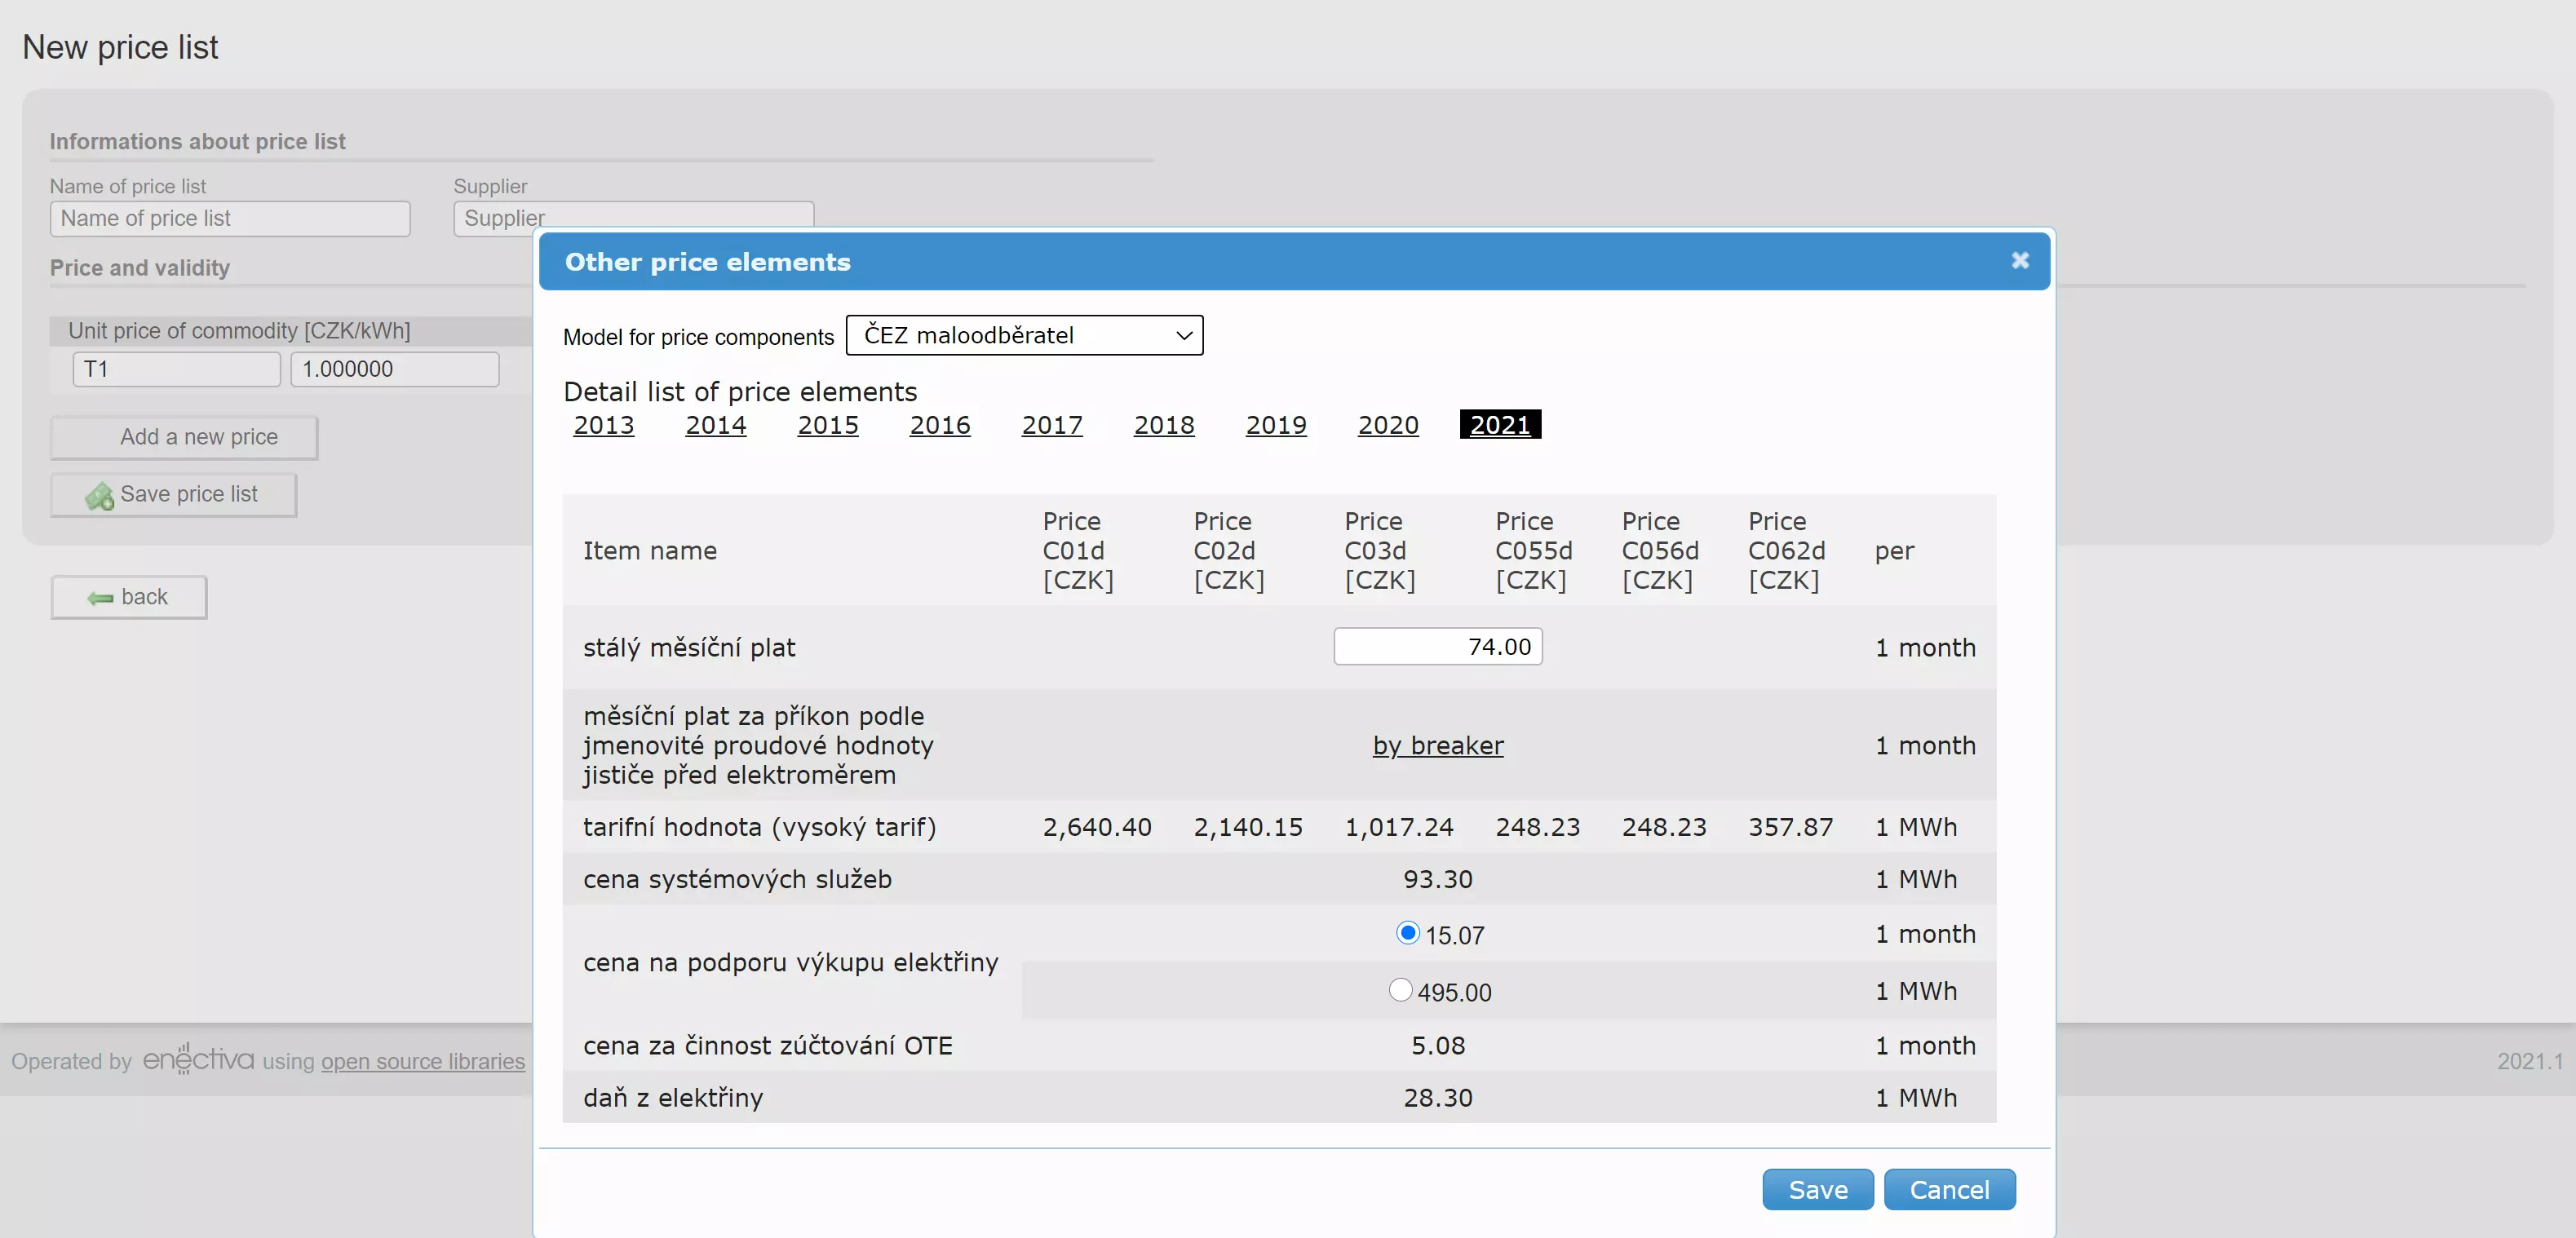
Enectiva contains price lists of all energy distributors operating in the Czech Republic. They are regularly updated according to the ERÚ (Energy Regulatory Office - Energetický regulační úřad). The system allows you to choose your distributor, enter the energy unit price agreed with the supplier, and Enectiva will automatically calculate the total costs according to current tariffs.
Energy events
You can store any event affecting your building or portfolio in Enectiva (such as heating/cooling source replacement, change in the energy supplier, change in energy prices, window replacement or building insulation). You can then view such changes in monthly consumption charts. This will allow you to easily see how such events affected consumption and costs. The savings achieved are also calculated since the event.
ISO 50001 compliance
The app is fully compliant with the internationally recognized ISO 50001 standard. Our customers, who use our energy management solutions, automatically meet 90% of this standard. ISO 50001 specifies the basic principles of monitoring, reporting and evaluating energy costs, including the implementation of cost-saving measures.
Intuitive user interface
Even non-technical users can understand energetics and energy management. When developing the user interface, our team emphasizes maximum ease of use and intuitiveness of Enectiva. All features and controls are built so that every user becomes proficient in using Enectiva after a brief introductory training.
Easy to navigate
You can always use the basic filters to quickly find a meter or sensor. You can view the building by floor, technologies by switchboard, or edit the meters directly in the floor plans. This eliminates the tedious search through documents and spreadsheets.
Order and system
Countless situations affecting consumption may arise when managing meters, entire buildings, or individual technologies. Replacing old meters, changing the tenant’s leased space, changing the cooling performance. Maintaining good order and providing a long-term system are also among our values.
Enectiva also knows how to do the following
Changes in energy prices directly in Enectiva
Thanks to its connection to the PEX and EEX energy exchanges, you can monitor electricity and gas price changes directly from Enectiva. This will allow you to identify the price development trend as well as the best time for an energy supplier selection procedure.
Google Maps will find a building quickly
Do you need to quickly find out information from several buildings in our portfolio? Drop the annoying search and opening of various files from the archive. Thanks to Enectiva’s connection to Google Maps, you can switch from one building to another in 3 clicks.
Binary data series
Not only meters and sensors are a source of data. Status such as open/closed or on/off can be also monitored in the app. Monitor door opening times, rotating drive operation or just the presence in a space.
