What is a heat map?
Heat map is a smart tool for representing and comparing collected data such as consumption of water, electricity or gas. Values are pictured by a color spectrum to quickly compare big amount of data. No energy audit will surprise you!
How to use heat map in Enectiva application?
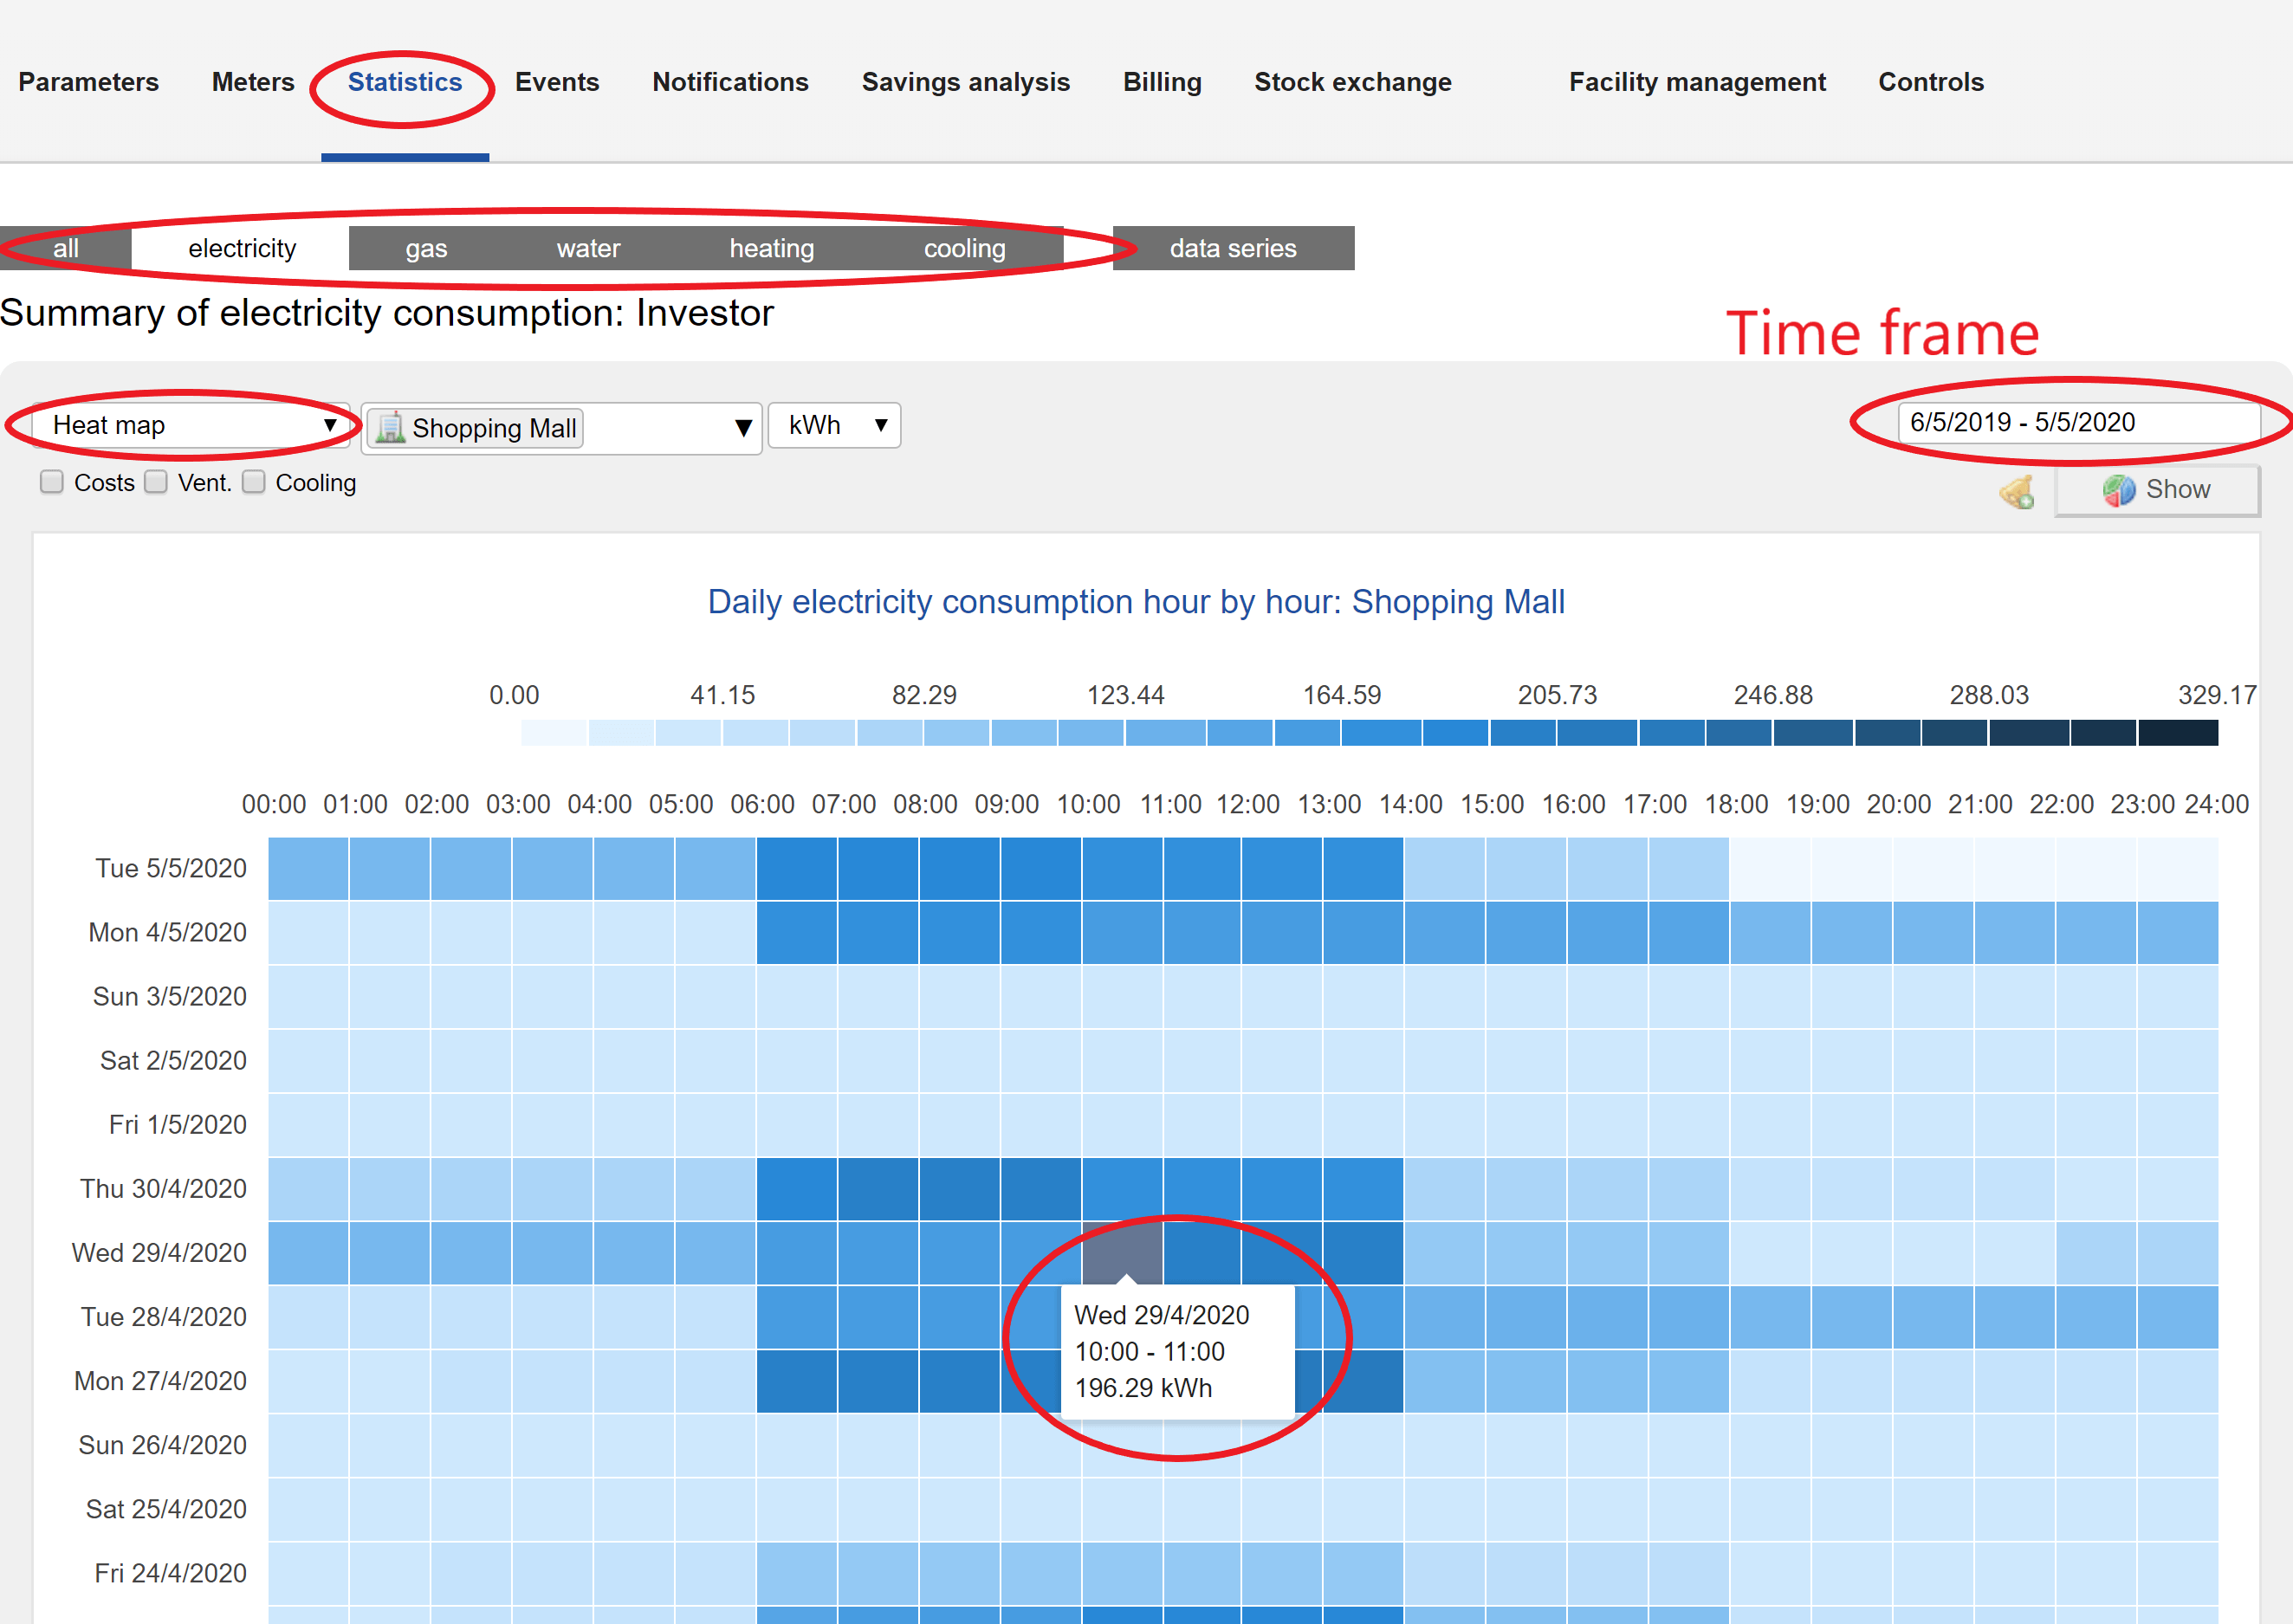
Heat map is a new means to present energy data. After logging in, select Statistics in the upper bar and underneath choose which type of energy we want to track. The heat map is one of the means of displaying data and a new type of graph: in the white bar open dropdown menu and choose Heat map. On the right select building or measurement source as well as time frame.

Colorful chart with different color shades will appear, the scale shows specific amount of consumption. The darker the color, the bigger the consumption. Rows represent days, columns represent hours. You can display details of a specific box by pointing the cursor on it.
How to read the heat map?
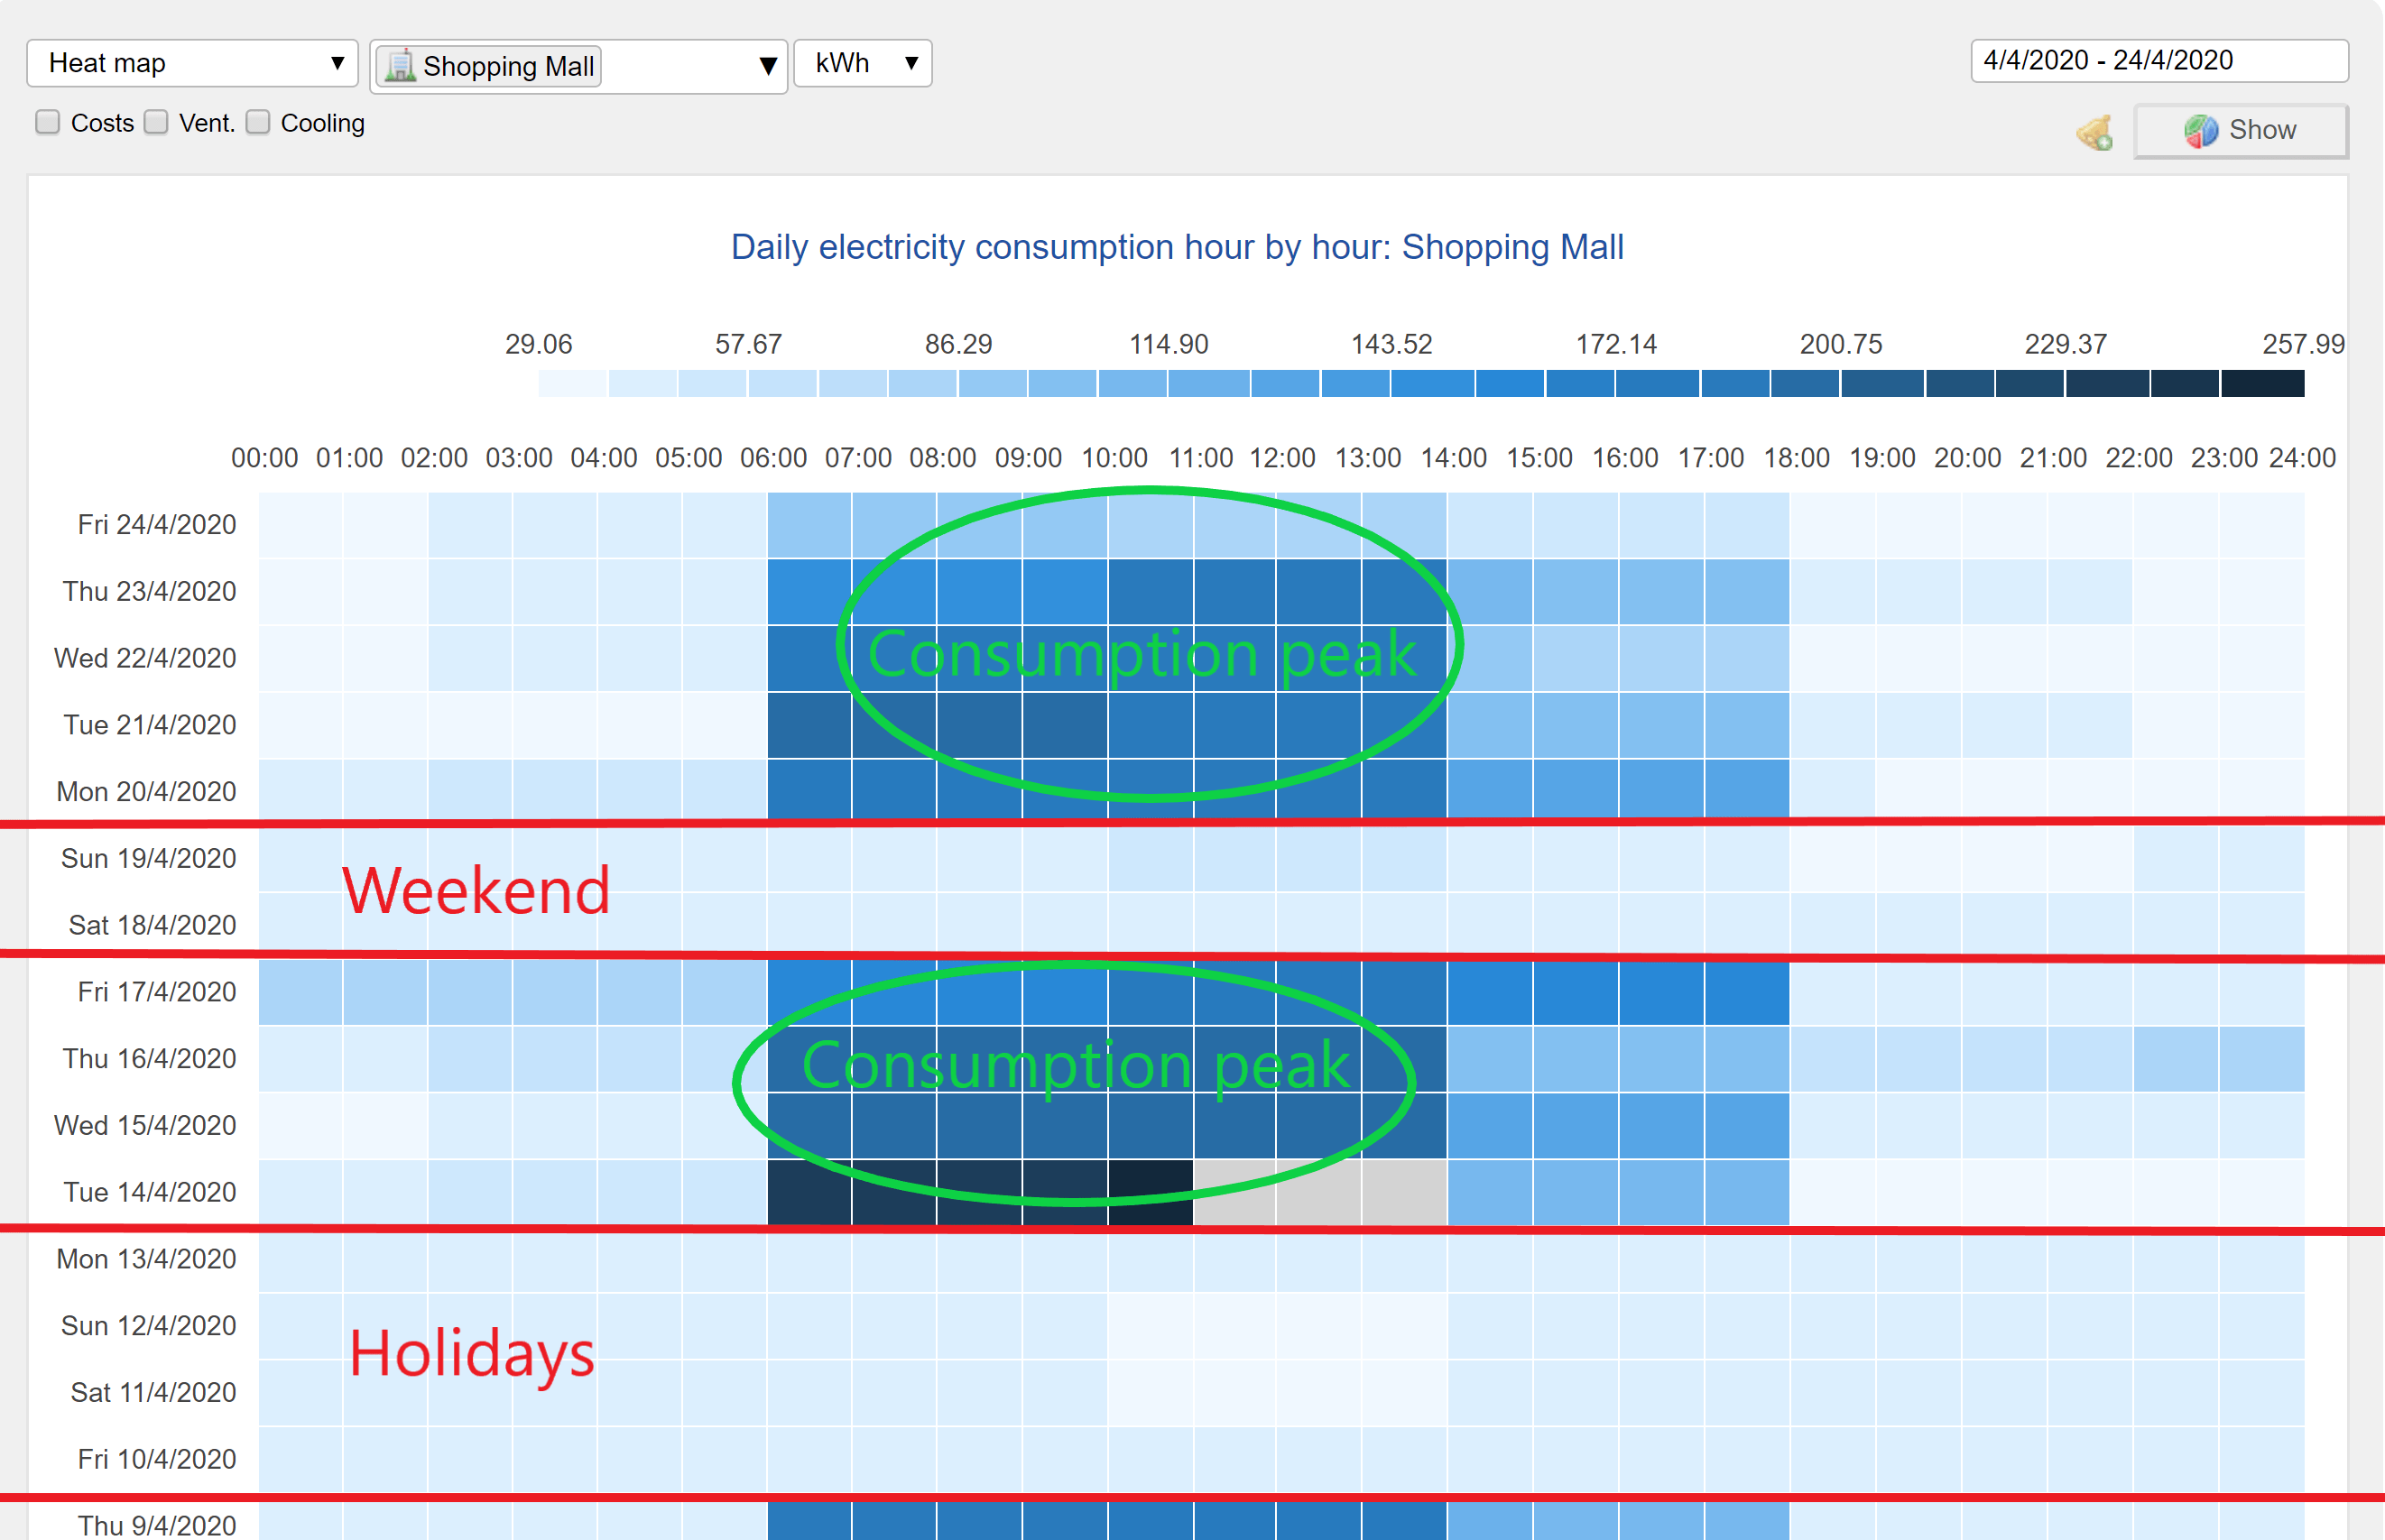
You can see at a first glance how the consumption varies within the day and week: usually we can see that working hours are more busy and, at night or during the holidays, the consumption is relatively lower. The advantage is that the scale is personalized to your consumption, so that you can easily compare the differences in consumption over months.

It is also possible to use the heat map to track peaks in consumption and decompose them to prevent overloading. In other words, thanks to information found you can easily dislocate the consumption into less busy hours.
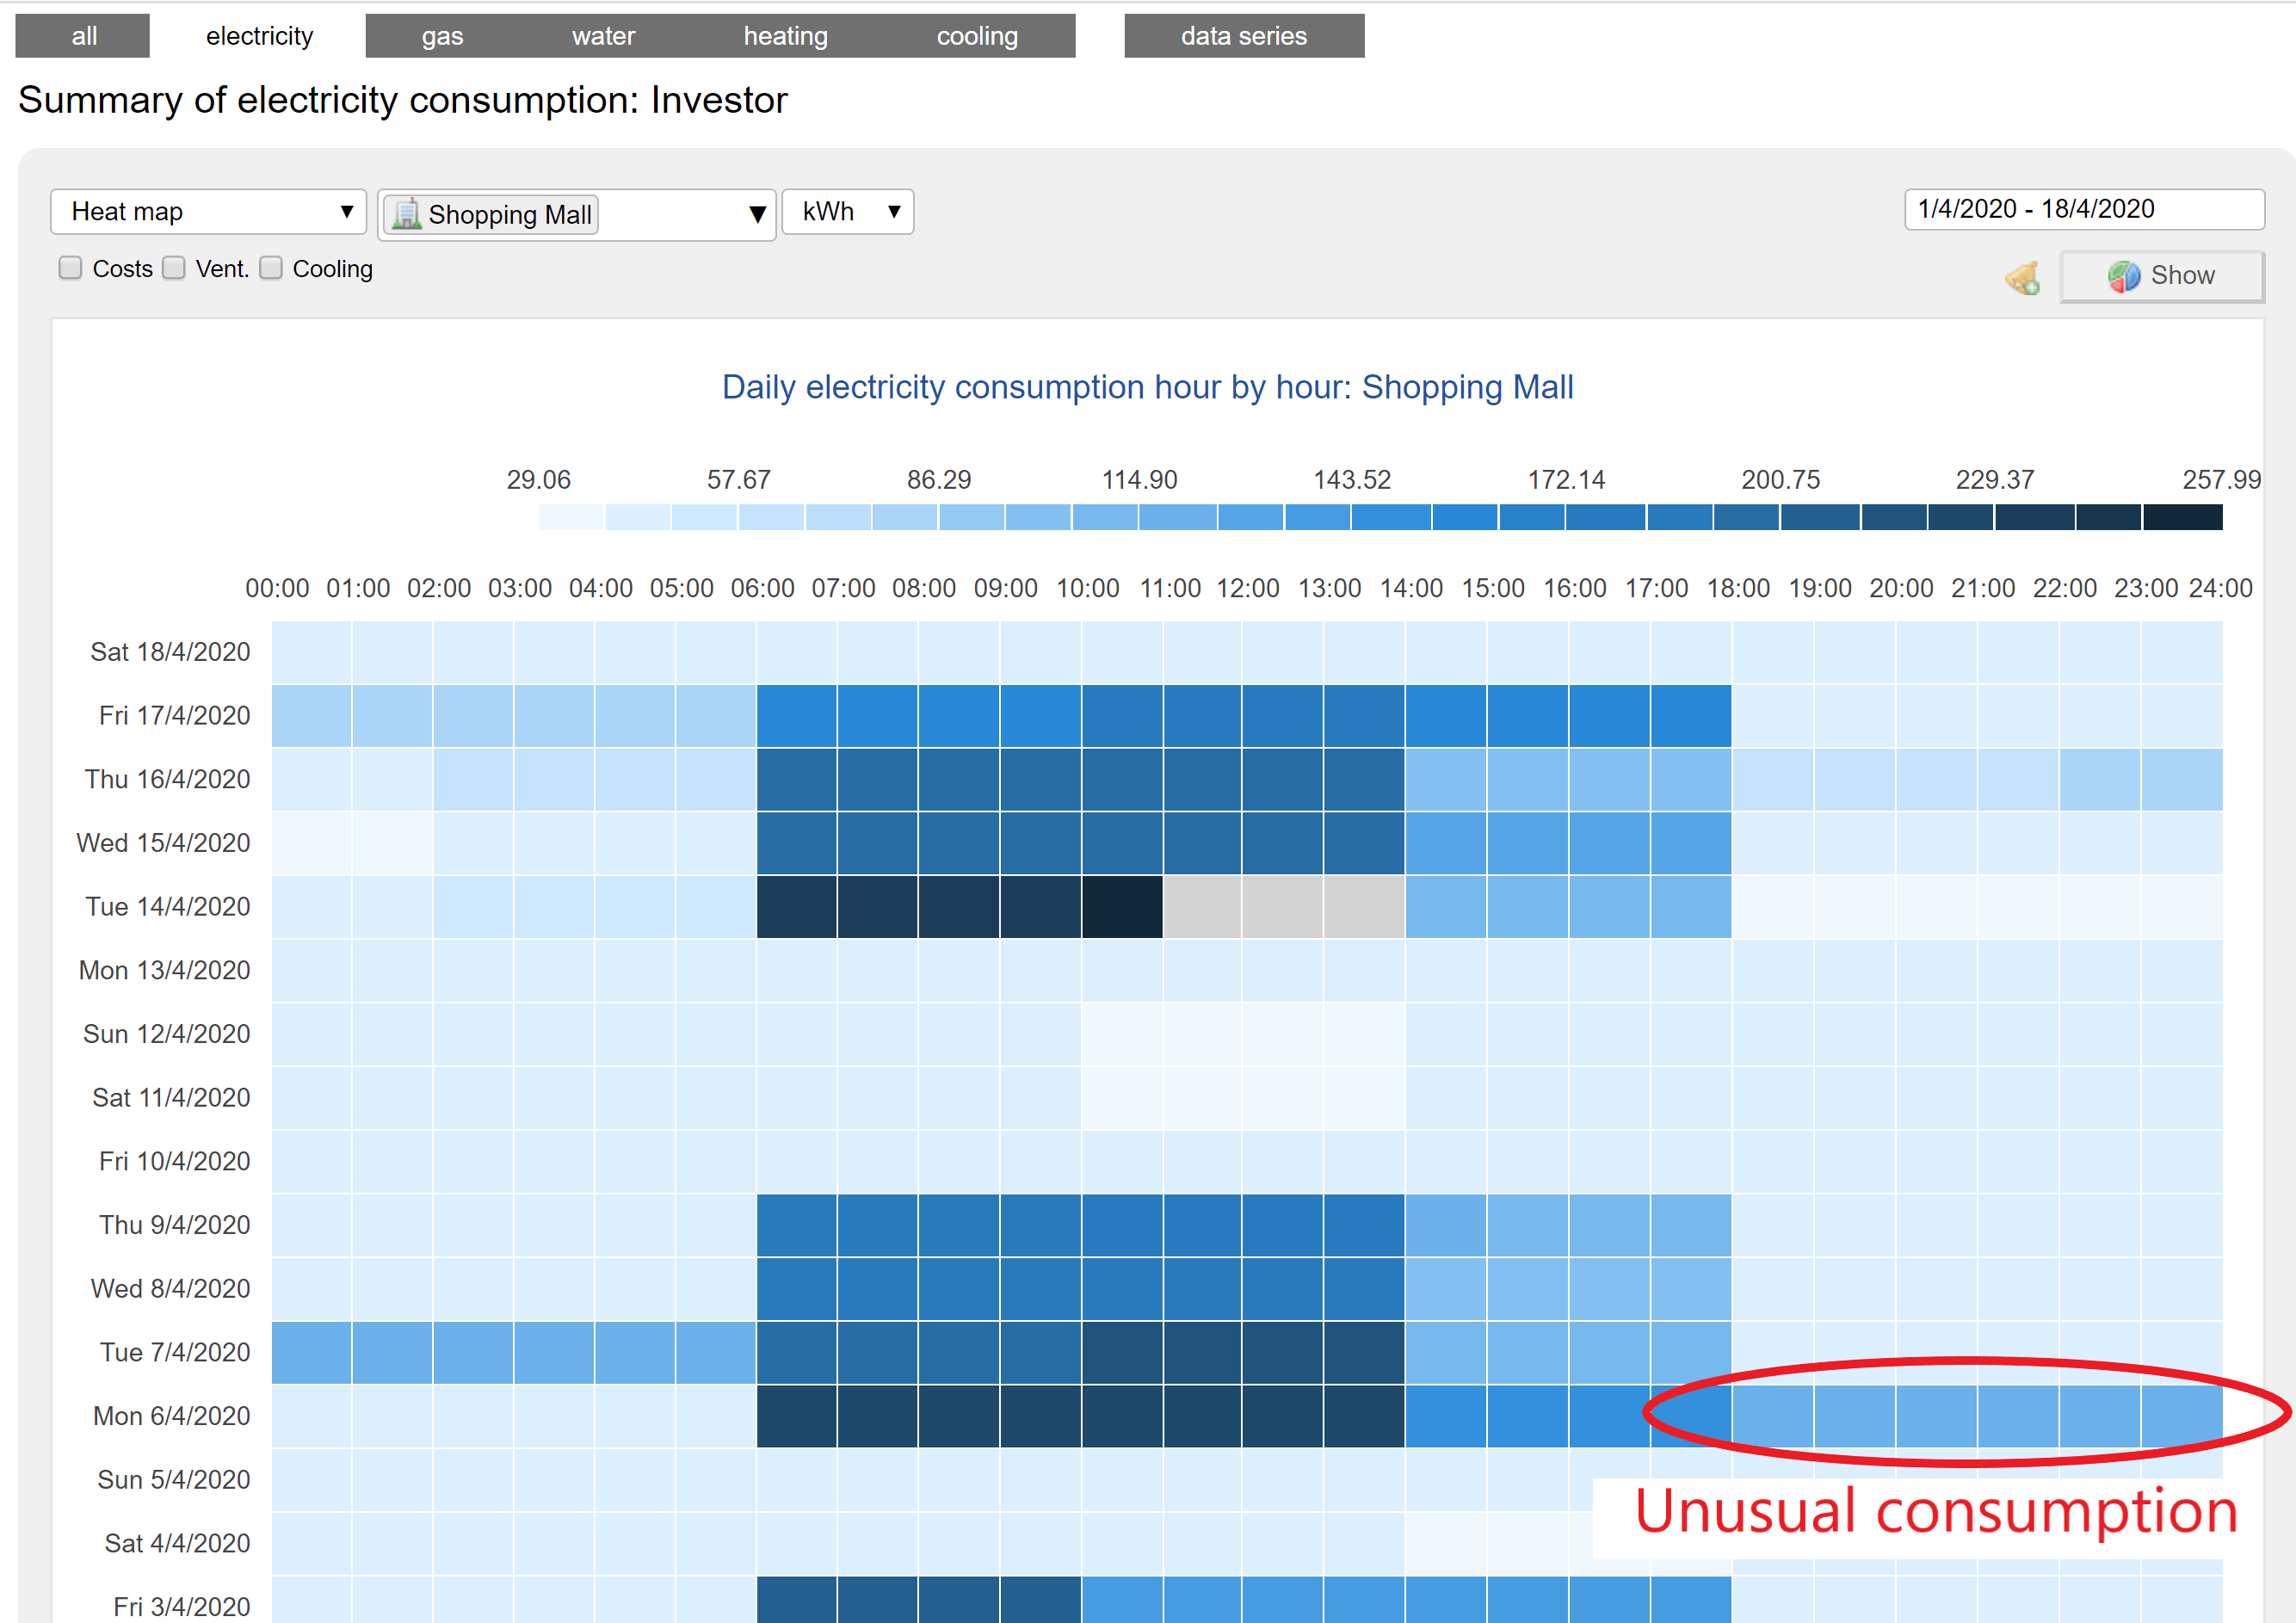
With heat map, you can also easily track unusual consumption of energy. High energy demand at night might mean some kind of failure.

As well as that, you can track consumption of individual technologies. If you have submeter, e. g for HVAC (Heating, Ventilating, Air-Conditioning).
With heat map you can easily track when does the technology switch on and whether its consumption should be optimized. Then it is possible to adjust the settings in the BMS (Building Management System).
We would like to hearing from you in case you have any tips for improvement!