What are data series?
Data series represent any kind of information source. It could be values measured by a sensor, number of people in a room, voltage value etc. In Enectiva, you can input (manually or automatically) any series of data from any sensor or meter (for example CO2 sensor, humidity sensor, temperature sensor etc.), in case of factory, you can input the number of products produced. Enectiva will then display your data series in function of time or in function of other data series (CO2 level in function of time, CO2 level in function of people in the room, electricity consumption in function of one product produced, the possibilities are endless)
How to create a data series?
Data series are always associated to one entity in the entity tree.
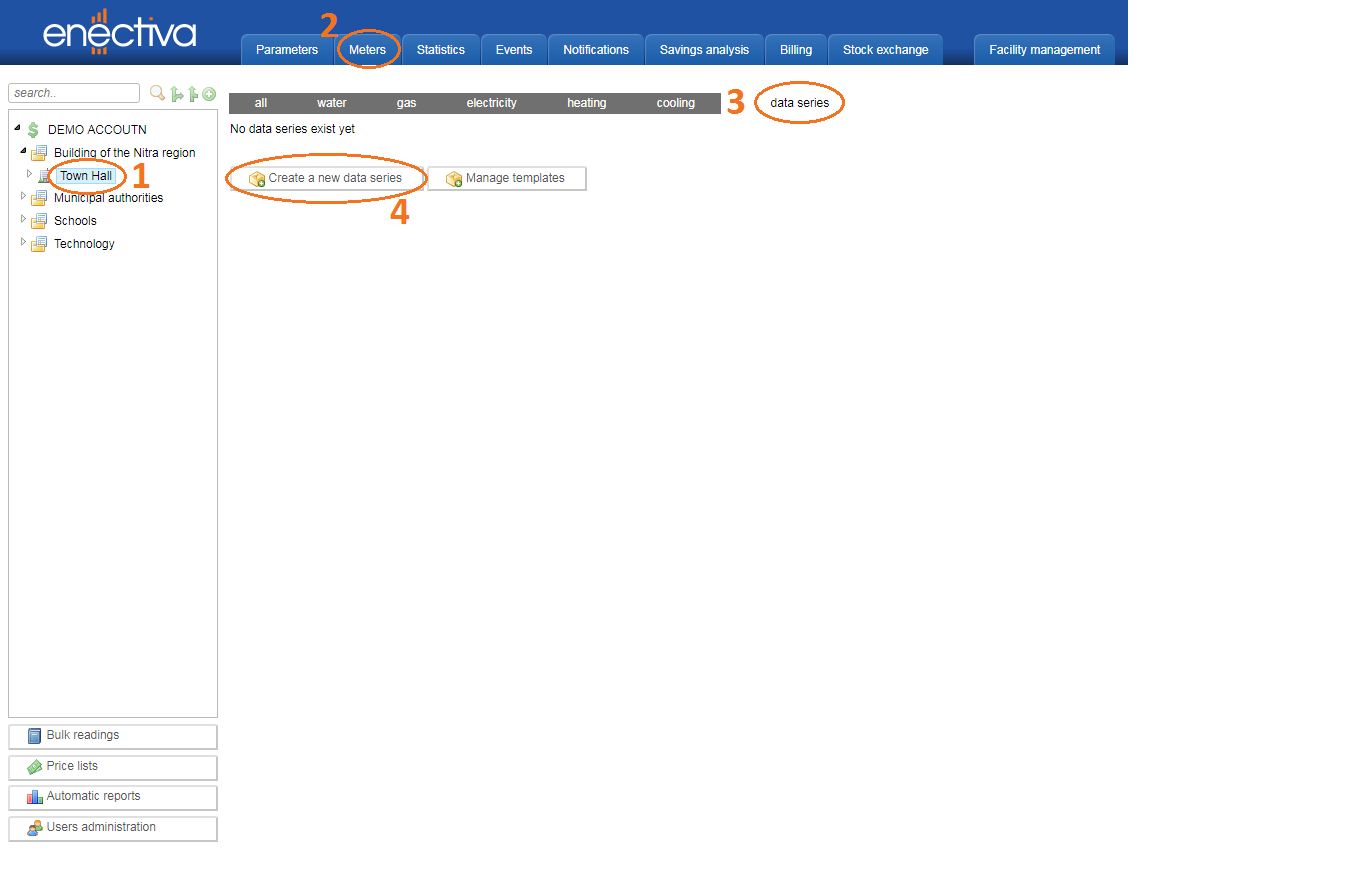
- Firstly, in the entity tree, click on the entity for which you will be creating your data series.
- Then click on “Meters” in the tool bar.
- After that, click on “data series”
- Finally, click on “Create a new data series”.
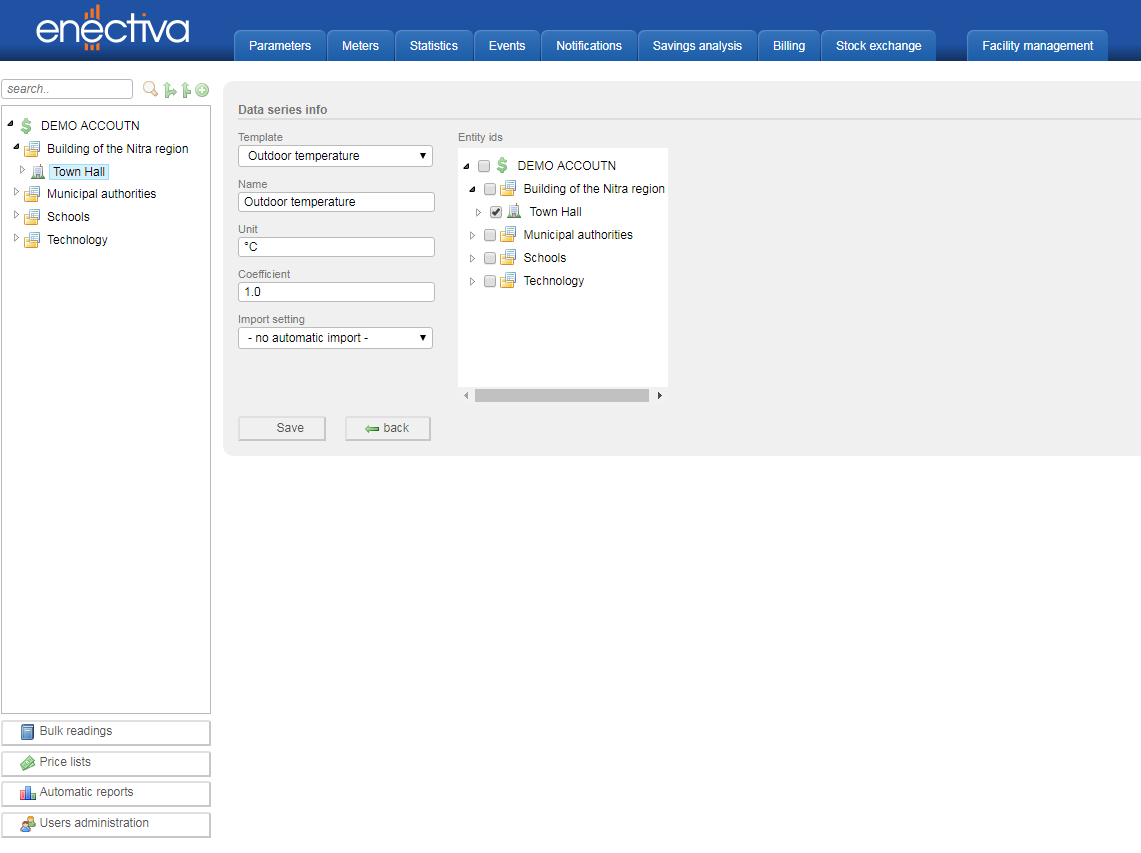
You will then see a couple of preprogrammed template for particular data series. You can of course create you very own template with your custom parameters, but firstly, we will create a data series using a preprogrammed templates - for example Outdoor temperature. After clicking on the chosen template, Enectiva will show you the information about it - name (outdoor temperature), unit (°C) and coefficient (number by which the app divides the input data). In case of outdoor temperature, there is no need for any division, so the coefficient value is 1.0. Then click “Save”.
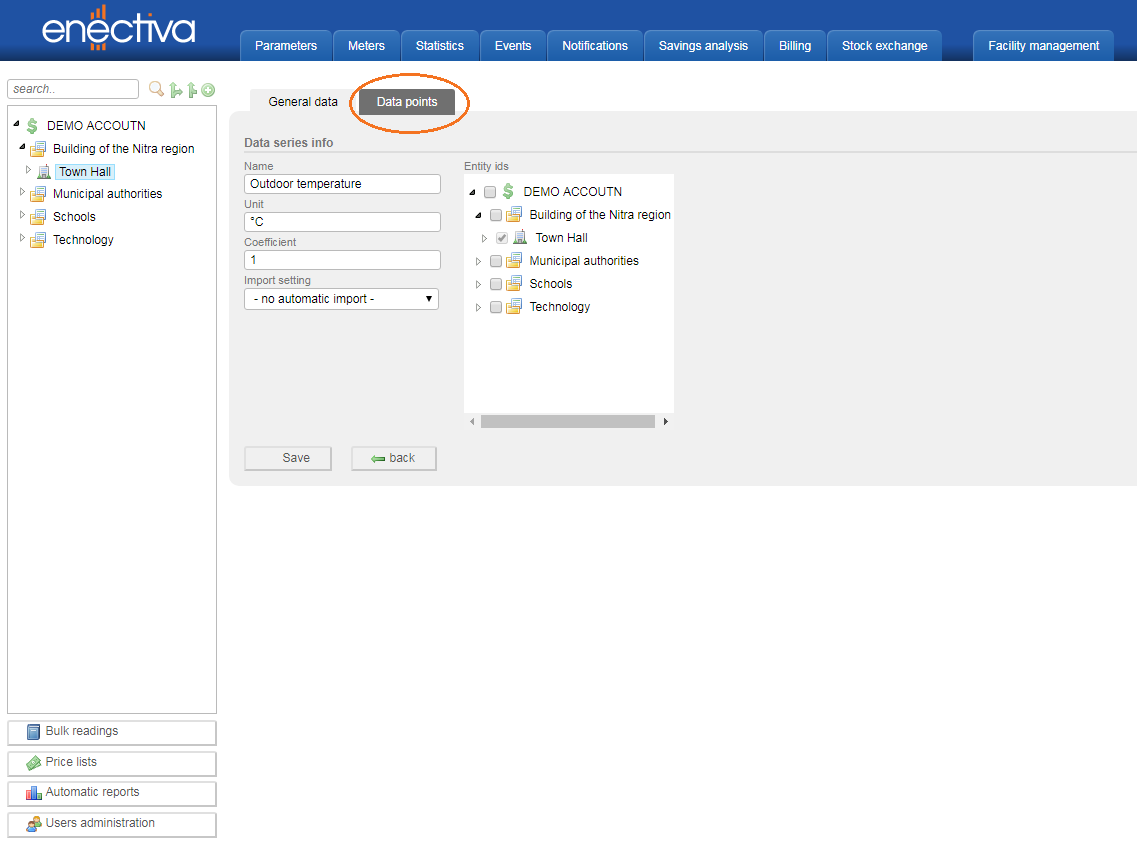
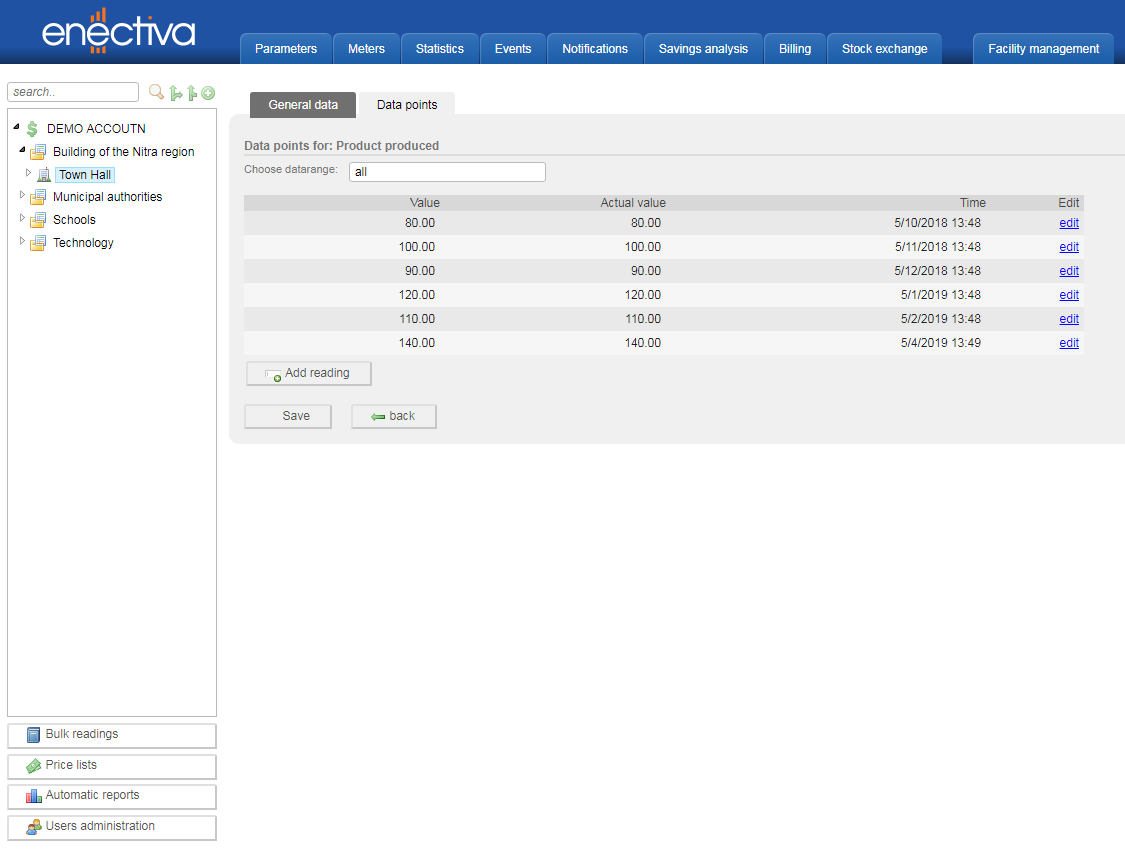
Now you can already see your created data series. To input some data into it, click on the data series and then click on “Data points”.
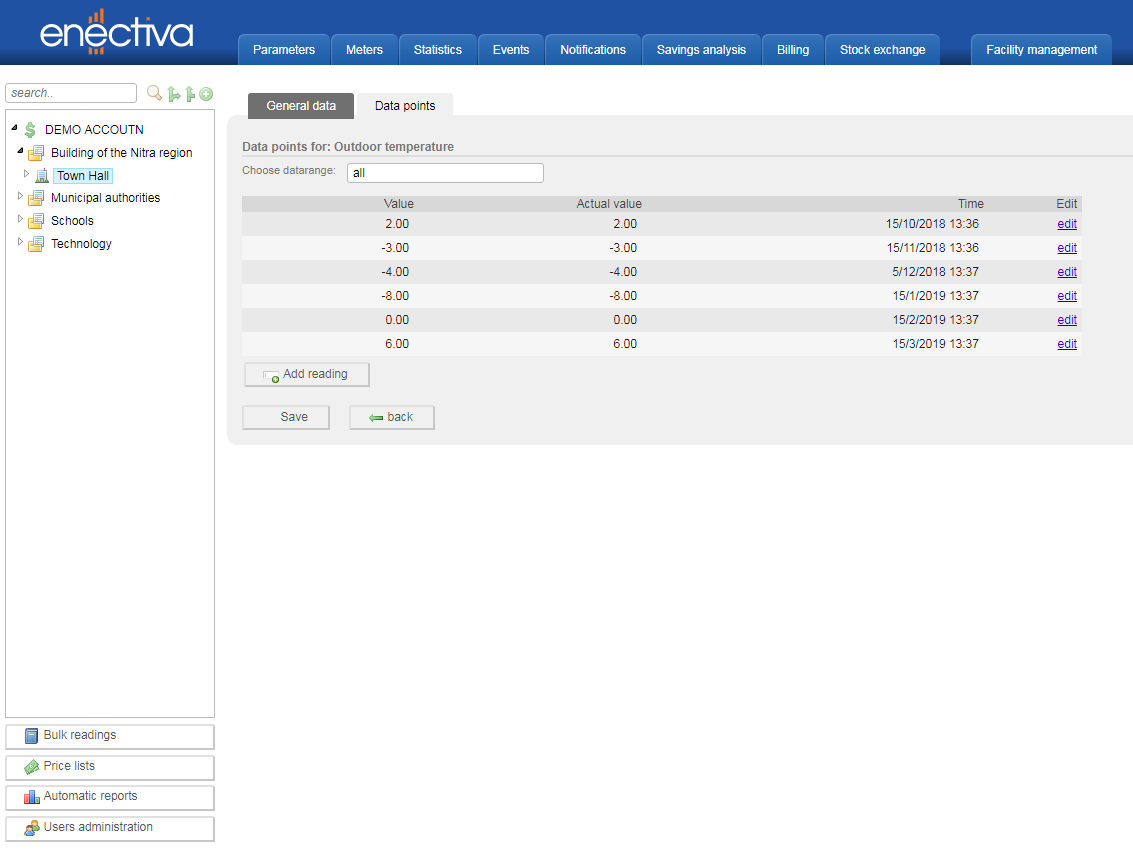
To input data, simply click on “Add reading” and then enter the value of the reading, date of the reading and save.
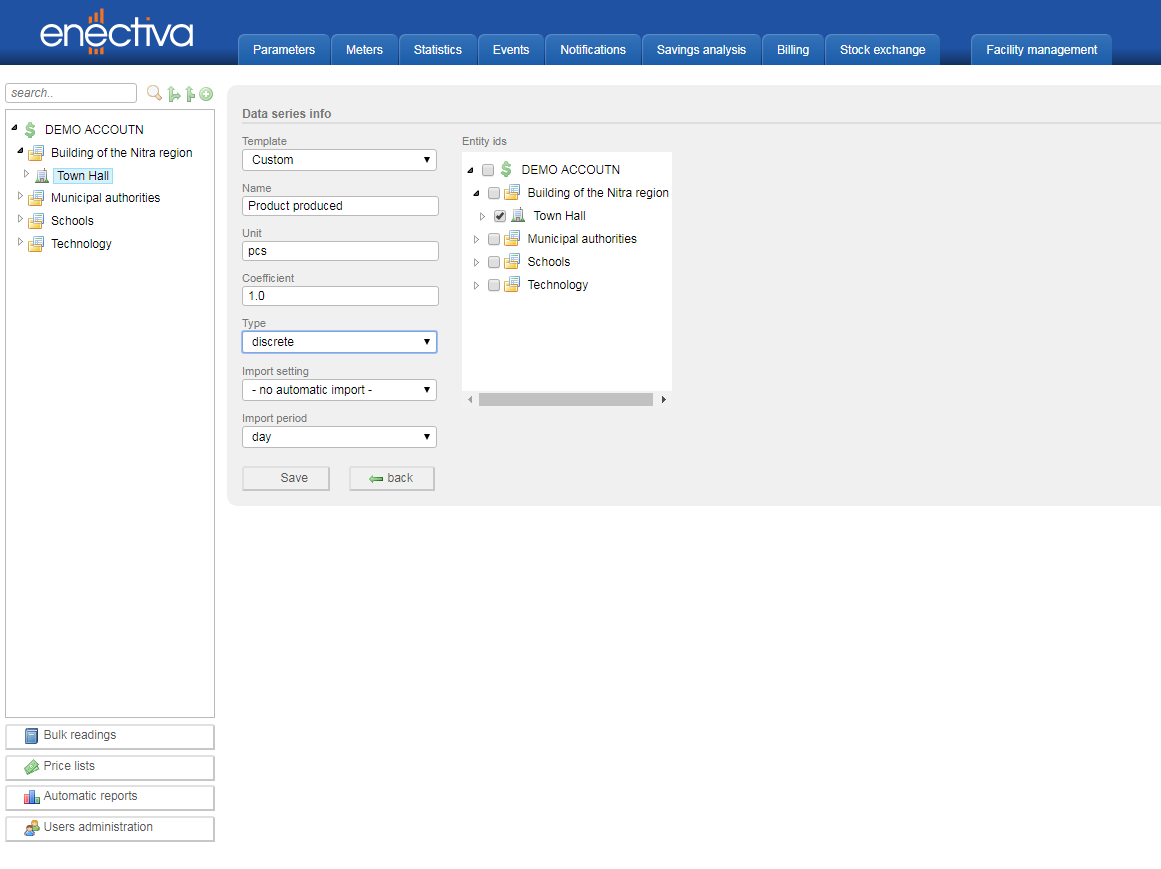
Now, we will create a data series without a preprogrammed template. Course of steps is the same as before, but now, in the template selection, we will choose “Custom”. Let’s say, we want to create a data series about product produced. The name is “Product produced”, unit is pcs (pieces), coefficient is again 1.0. Type of function is discrete, because product produced can be expressed only with integers, and it is not a continuous nor a binary function. Import period can be for example day.
And data input is the same as before.
Graphical display of data series
You can display data series in graphs. To do so:
- Make sure that you are in a good entity in the entity tree
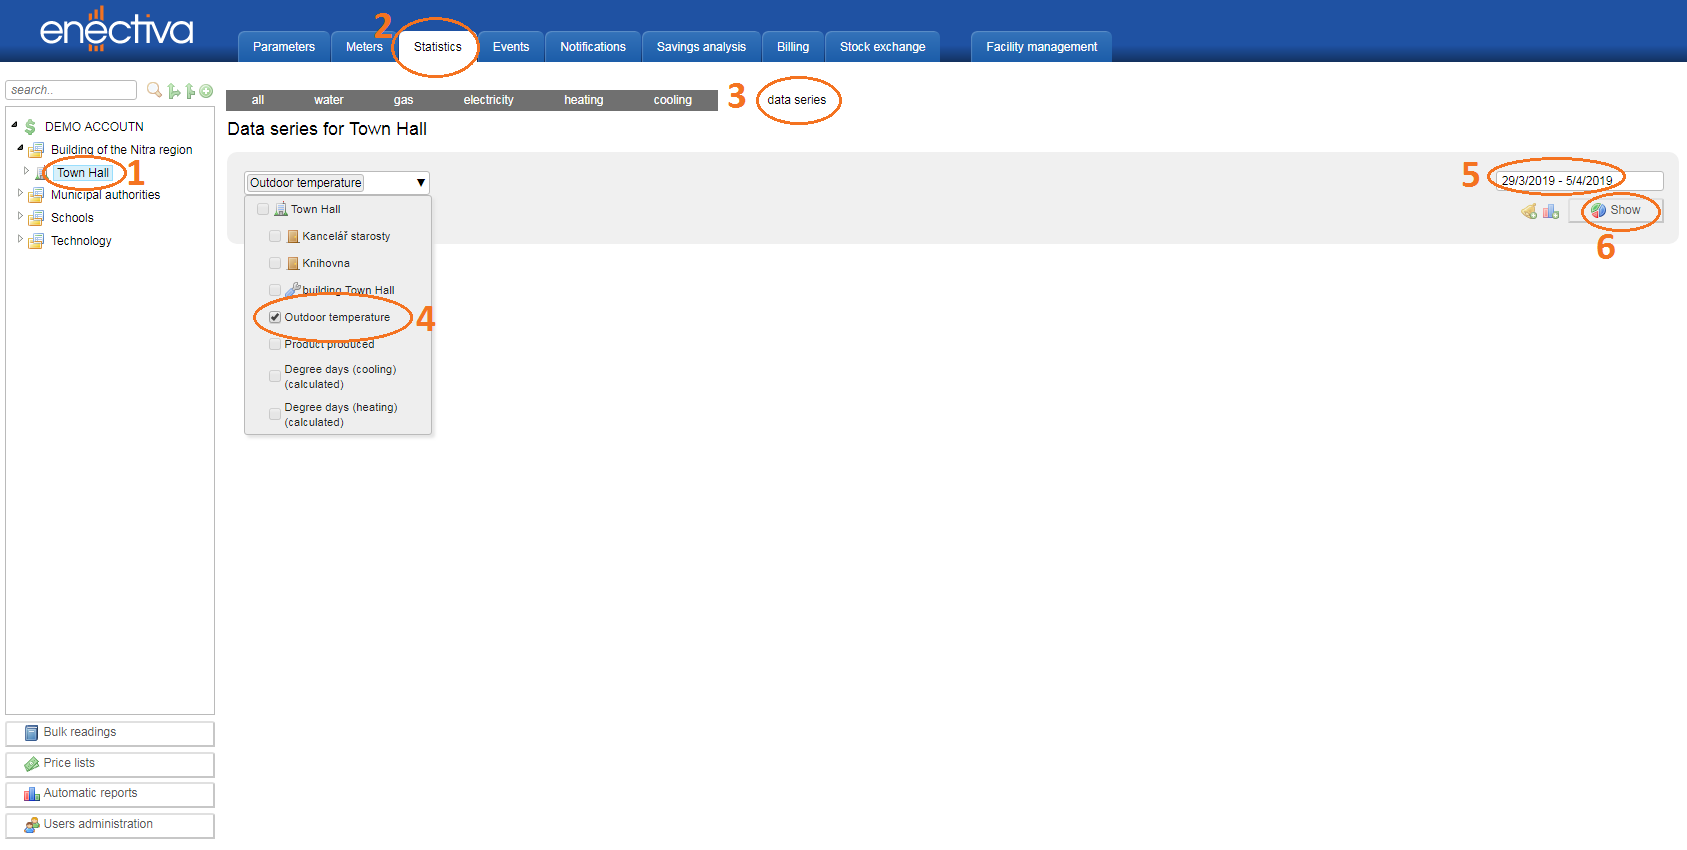
- Click on “Statistics” in your toolbar
- Then click on “data series”.
- After that, choose the data series you would like to display
- Choose the time period you would like to see
- Finally click on “Show”.
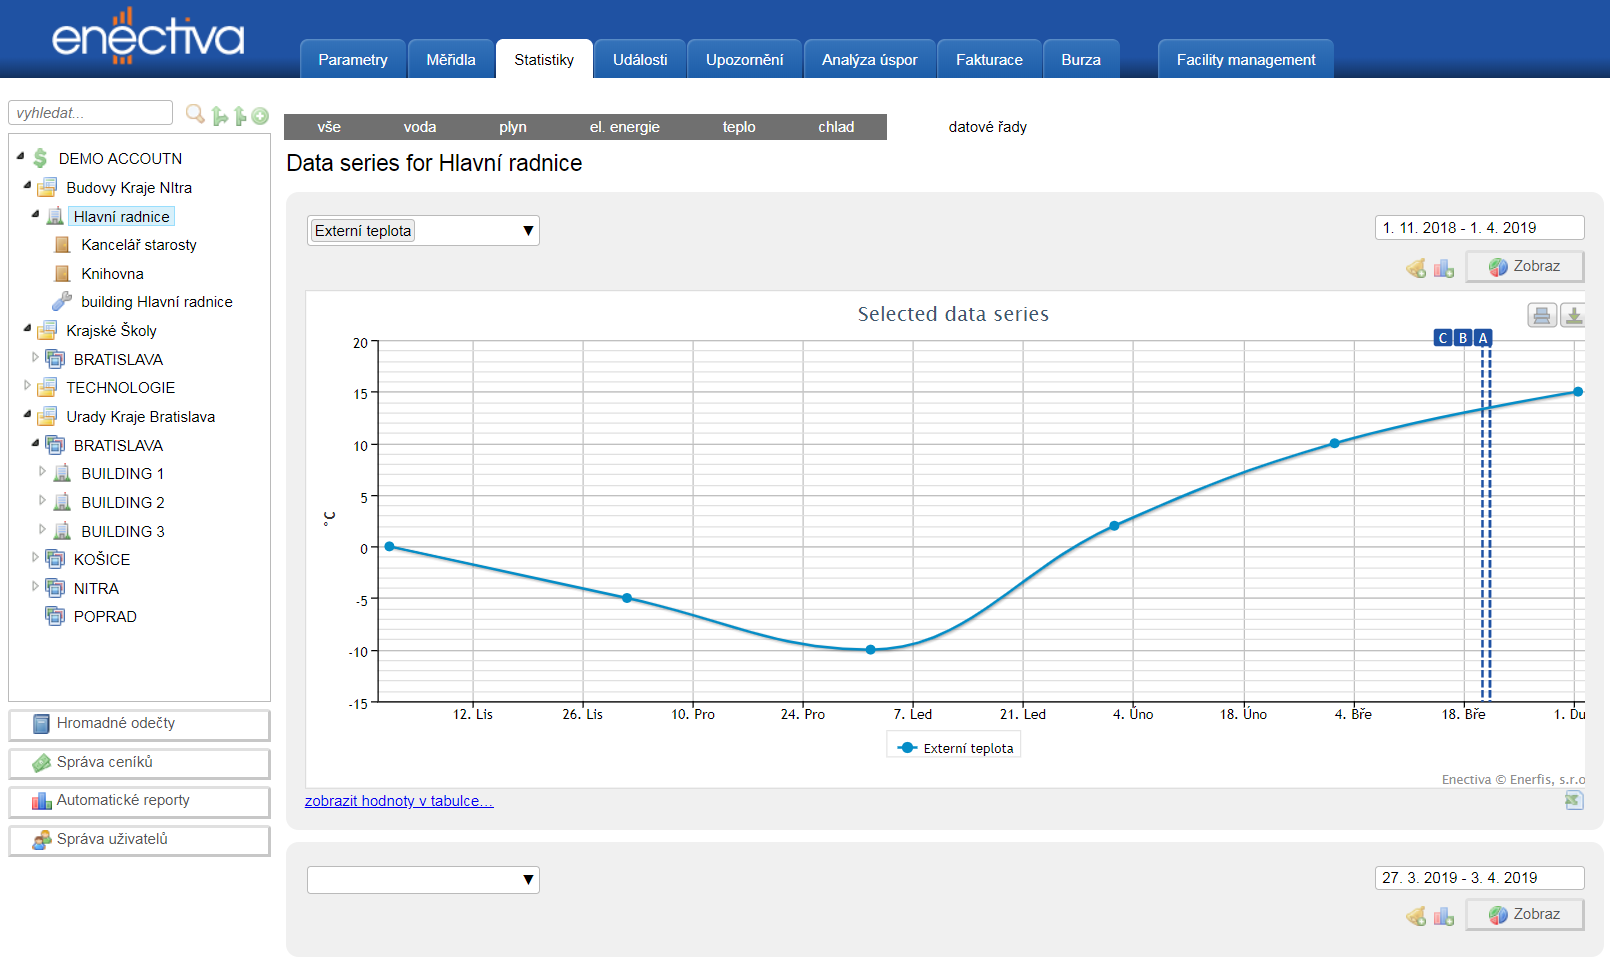
The final graph would look like this:
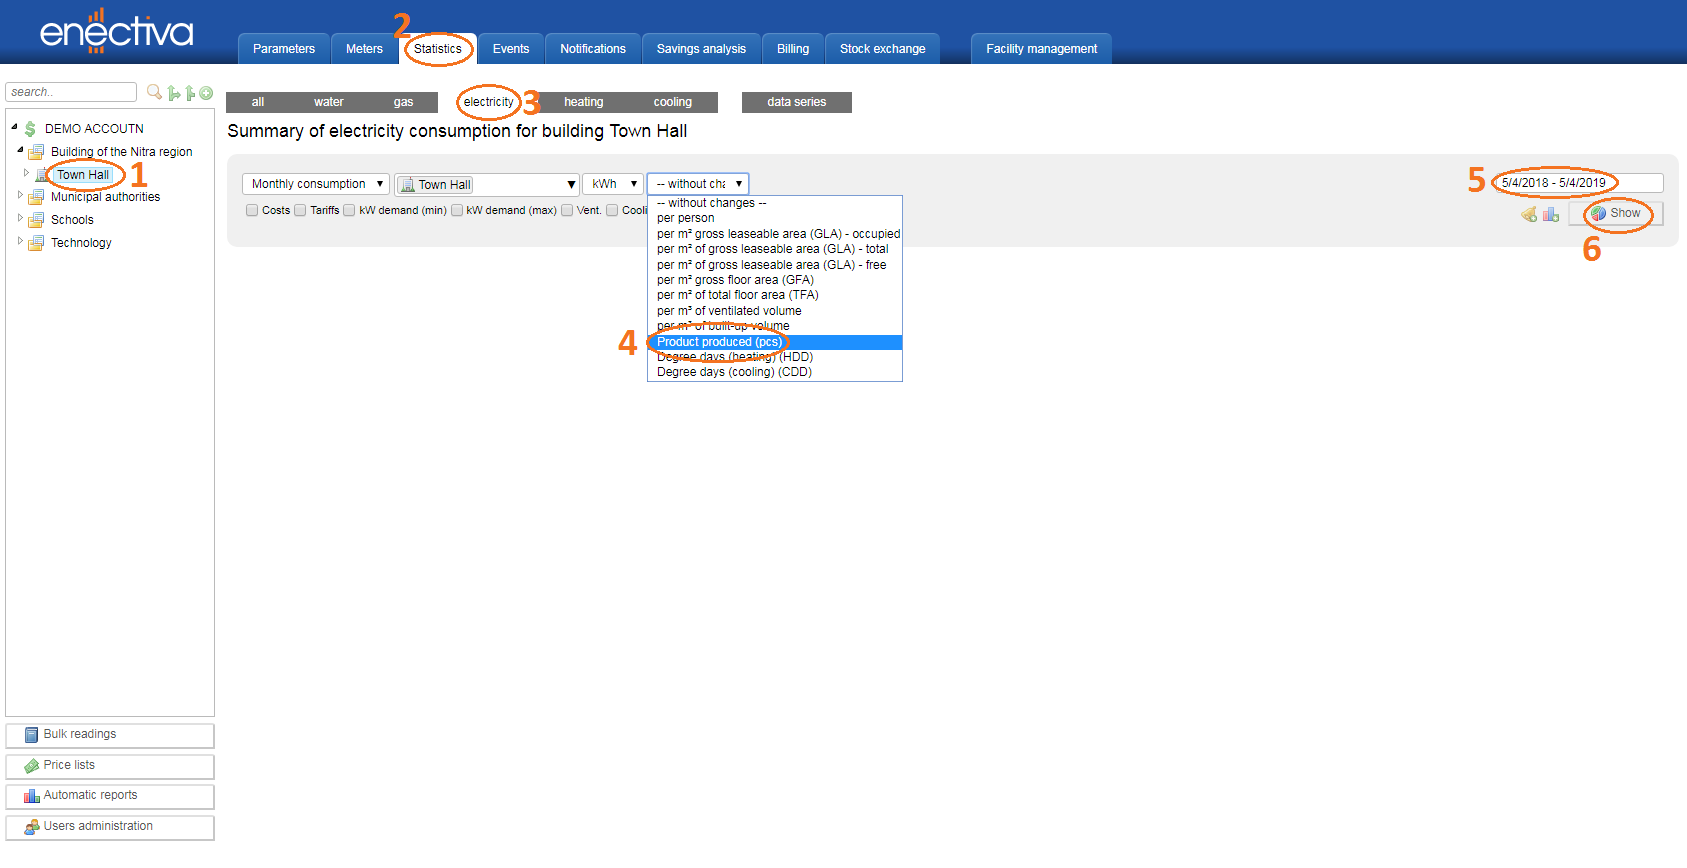
If you want to display for example energy consumption in function of one product produced:
- Make sure that you are in a good entity in the entity tree
- Go in “Statistics
- Click on “electricity”
- In the last selection bar, choose “Product produced”.
- Then choose time period
- Finally click on “Show”.
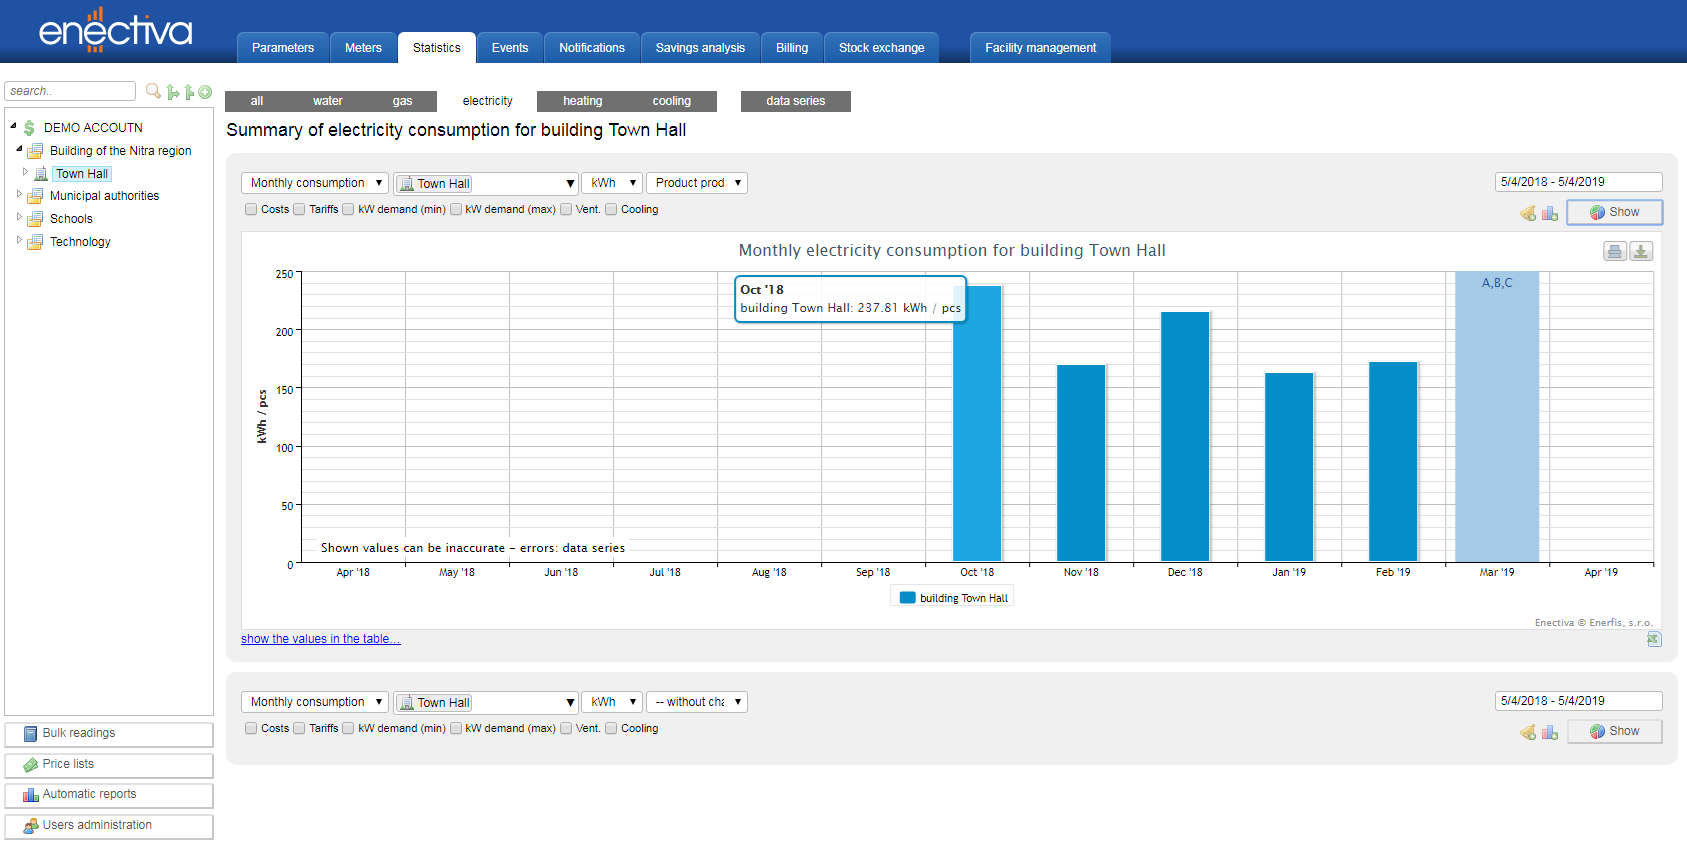
The final graph would look like this:
Do not hesitate to use the full potential of your new feature to discover even more about energetic properties and possibilities of your facility. In case of any questions, contact us on info@enectiva.cz