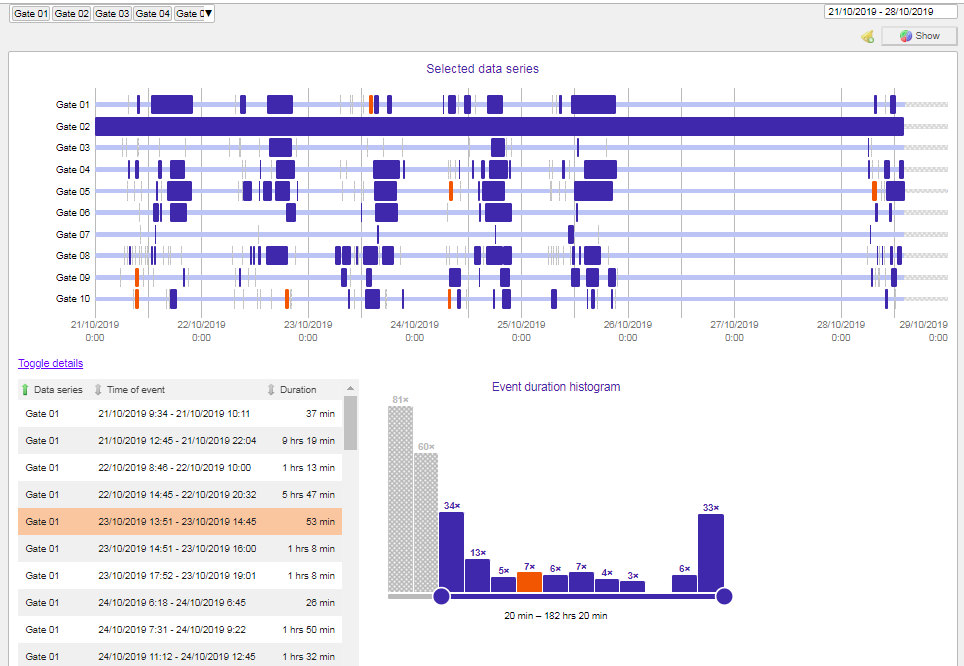
We have improved the user interface of binary data series for better clarity and efficiency. Binary data series are usually used to monitor two opposed states, such as open/closed, on/off etc. The typical example of binary data series usage is the monitoring of how long your gate is open or how long are the lights on in your factory.
What can you monitor with binary data series: How long is a gate open
- How long the lights are on
- How long is a certain switch in a certain position (such as switch on lighting, AC, ventilation…)
- The presence of people (some in present x someone is absent)

The main motivation is always to save money. In case of monitoring doors and gates, the typical energy management know-how says that you can save up to 6 % of your heating expenses if you decrease the room temperature by 1 °C. Why should you lose heat just because your gate is open? Thus, in case of monitoring how long your gate open or closed, you need to monitor the temperature as well. We recommend to add an automatic notification that will remind you if a certain gate is open too long. You can combine binary data series with a people counter as well.
In the picture, you can see what a typical binary data series looks like. We chose as an example a monitoring of 10 gates in a factory. Each gate has its own data series that shows it state in a certain period.
Features you might like:
- If you point your cursor at a certain period, the app will show you its duration, when it started and when it ended
- If you click on the button “Toggle details” that is located below the graph, you will see details of individual events
- You can arrange the events from newest to oldest and vice versa
A very interesting function is the Event duration histogram, which lets you easily see only the events with duration that interests you. In this case, the histogram shows only events with duration longer than 20 minutes. The histogram can be displayed by clicking the button “Toggle details” below the graph.
What will you need to implement such monitoring?
You can use any hardware that allows monitoring of two different states. They can be analog or digital, but that does not have to concern you, since Enectiva is able to integrate most of the basic outputs. To monitor gates, we use PLC with digital outputs, which are connected to the signal relay of the gate control unit. PLC then uses MQTT to send information about the gate state and its changes to the Enectiva servers. The price of such PLC, that is able to perform such operation depends on the number on outputs, but it’s usually about 400 € without tax. PLC outputs can be also connected to sound or light signalization which would remind the workers to close the gate after being open for more than for example 10 minutes.
Would you like more information about gate monitoring or data series? Do not hesitate to contact us sales@enectiva.com or on +420 222 766 950